Priceline 2011 Annual Report Download - page 44
Download and view the complete annual report
Please find page 44 of the 2011 Priceline annual report below. You can navigate through the pages in the report by either clicking on the pages listed below, or by using the keyword search tool below to find specific information within the annual report.-
 1
1 -
2
-
3
-
4
-
5
-
6
-
7
-
8
-
9
-
10
-
11
-
12
-
13
-
14
-
15
-
16
-
17
-
18
-
19
-
20
-
21
-
22
-
23
-
24
-
25
-
26
-
27
-
28
-
29
-
30
-
31
-
32
-
33
-
 34
34 -
 35
35 -
 36
36 -
 37
37 -
 38
38 -
 39
39 -
 40
40 -
 41
41 -
 42
42 -
 43
43 -
 44
44 -
 45
45 -
 46
46 -
 47
47 -
 48
48 -
 49
49 -
 50
50 -
 51
51 -
 52
52 -
 53
53 -
 54
54 -
55
-
56
-
57
-
58
-
59
-
60
-
61
-
62
-
63
-
64
-
65
-
66
-
67
-
68
-
69
-
70
-
71
-
72
-
73
-
74
-
75
-
76
-
77
-
78
-
79
-
80
-
81
-
82
-
83
-
84
-
85
-
86
-
87
-
88
-
89
-
90
-
91
-
92
-
93
-
94
-
95
-
96
-
97
-
98
-
99
-
100
-
101
-
102
-
103
-
104
-
105
-
106
-
107
-
108
-
109
-
110
-
111
 |
 |

43
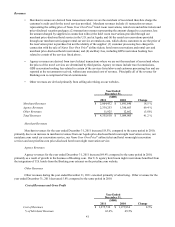
by brand mix rather than a change in the fundamental efficiency of our advertising by brand. Our international operations are
growing faster than our priceline.com business in the U.S., and spend a higher percentage of gross profit on online advertising,
a trend which we expect to continue. Furthermore, the priceline.com brand is obtaining an increasing share of its traffic
through online advertising, a trend which we also expect to continue. We recognize advertising expense as incurred at the time
of booking, but recognize the gross profit for price-disclosed hotel room and rental car reservations when the travel is
completed.
Offline advertising expenses are related to our domestic television, print and radio advertising for priceline.com. For
the year ended December 31, 2011, offline advertising was flat compared to the same period in 2010. We recognize expense
for production costs of advertising the first time the advertising takes place.
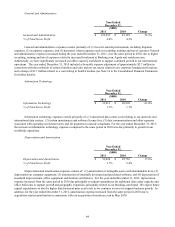
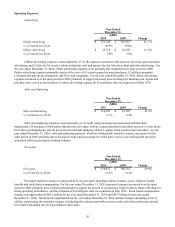
Sales and Marketing
Sales and Marketing
% of Total Gross Profit
Year Ended
December 31,
($000)
2011
$ 162,690
5.3%
2010
$ 116,303
6.1%
Change
39.9%
Sales and marketing expenses consist primarily of (1) credit card processing fees associated with merchant
transactions; (2) fees paid to third-parties that provide call center, website content translations and other services; (3) provisions
for credit card chargebacks; and (4) provisions for bad debt, primarily related to agency hotel commission receivables. For the
year ended December 31, 2011, sales and marketing expenses, which are substantially variable in nature, increased over the
same period in 2010, primarily due to increased gross booking volumes as well as expenses related to increased content
translations. Our U.S. merchant business benefited from the impact of reduced credit card processing fees resulting from
Durbin Amendment to the Dodd-Frank Financial Reform and Consumer Protection Act (which amendment caps the
interchange fee for debit card transactions and went into effect on October 1, 2011), partially offset by the impact of higher
costs resulting from increases in foreign currency transactions and increased cancellation rates from our Agoda business. Costs
associated with our U.S. priceline.com business comprise a large component of sales and marketing expenses. Our U.S.
priceline.com business grew more slowly than our total gross profit, which benefited from the high growth in our international
agency business, and as a result, sales and marketing expenses as a percentage of total gross profit for the year ended December
31, 2011 declined compared to the same period in 2010.
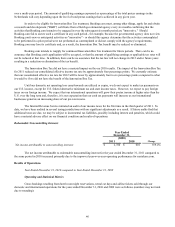
Personnel
Personnel
% of Total Gross Profit
Year Ended
December 31,
($000)
2011
$ 352,295
11.4%
2010
$ 270,071
14.1%
Change
30.4%
Personnel expenses consist of compensation to our personnel, including salaries, bonuses, payroll taxes, employee health
benefits and stock-based compensation. For the year ended December 31, 2011, personnel expenses increased over the same
period in 2010, due primarily to increased headcount to support the growth of our international businesses. Stock-based
compensation expense was approximately $65.7 million for the year ended December 31, 2011 compared to $68.2 million for
the year ended December 31, 2010. Stock-based compensation for the years ended December 31, 2011 and 2010 included
charges amounting to $10.3 million and $13.4 million, respectively, representing the cumulative impact of adjusting the
estimated probable outcome at the end of the performance period for certain outstanding unvested performance share units.