Priceline 2011 Annual Report Download - page 80
Download and view the complete annual report
Please find page 80 of the 2011 Priceline annual report below. You can navigate through the pages in the report by either clicking on the pages listed below, or by using the keyword search tool below to find specific information within the annual report.-
 1
1 -
2
-
3
-
4
-
5
-
6
-
7
-
8
-
9
-
10
-
11
-
12
-
13
-
14
-
15
-
16
-
17
-
18
-
19
-
20
-
21
-
22
-
23
-
24
-
25
-
26
-
27
-
28
-
29
-
30
-
31
-
32
-
33
-
34
-
35
-
36
-
37
-
38
-
39
-
40
-
41
-
42
-
43
-
44
-
45
-
46
-
47
-
48
-
49
-
50
-
51
-
52
-
53
-
54
-
55
-
56
-
57
-
58
-
59
-
60
-
61
-
62
-
63
-
64
-
65
-
66
-
67
-
68
-
69
-
 70
70 -
 71
71 -
 72
72 -
 73
73 -
 74
74 -
 75
75 -
 76
76 -
 77
77 -
 78
78 -
 79
79 -
 80
80 -
 81
81 -
 82
82 -
 83
83 -
 84
84 -
 85
85 -
 86
86 -
 87
87 -
 88
88 -
 89
89 -
 90
90 -
91
-
92
-
93
-
94
-
95
-
96
-
97
-
98
-
99
-
100
-
101
-
102
-
103
-
104
-
105
-
106
-
107
-
108
-
109
-
110
-
111
 |
 |

79
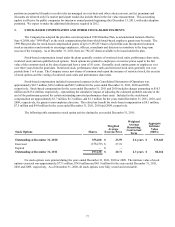
Stock-based compensation for performance share units is recorded based on the estimated probable outcome if the
Company, and with respect to certain grants, its subsidiaries, priceline.com International and Agoda, achieve certain financial
goals at the end of the performance period. The actual number of shares to be issued will be determined upon completion of
the performance period, assuming there is no accelerated vesting for, among other things, a termination of employment under
certain circumstances, or a change in control.
2011 Performance Share Units
During the year ended December 31, 2011, stock-based awards included grants of 77,144 performance share units
with a grant date fair value of $35.9 million, based on a weighted average grant date fair value of $464.79 per share. The
actual number of shares will be determined upon completion of the performance period which ends December 31, 2013.
At December 31, 2011, there were 76,552 unvested performance share units outstanding, net of actual forfeitures and
vesting. During the year ended December 31, 2011, the number of shares estimated as probable to be issued at the end of the
performance period increased by 76,817 shares.
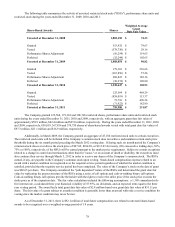
As of December 31, 2011, the number of shares estimated to be issued at the end of the performance period is a total
of 153,369 shares. If the maximum performance thresholds are met at the end of the performance period, a maximum of
163,324 total shares could be issued.
2010 Performance Share Units
During the year ended December 31, 2010, stock-based awards included grants of 110,430 performance share units
with a grant date fair value of $26.0 million, based on a weighted average grant date fair value of $235.34 per share. The actual
number of shares will be determined upon completion of the performance period which ends December 31, 2012.
At December 31, 2011 and 2010, there were 93,745 and 108,702 unvested performance share units outstanding, net of
actual forfeitures and vesting, respectively. During the year ended December 31, 2010, the number of shares estimated as
probable to be issued at the end of the performance period increased by 154,177 shares.
As of December 31, 2011, the number of shares estimated to be issued at the end of the performance period is a total
of 226,505 shares. The maximum number of total shares that could be issued at the end of the performance period is 226,505
shares.
Other Stock-based Payments
In 2010, the Company granted 5,555 RSUs with a total grant date fair value of $1.6 million to an advertising partner.
Expense is amortized over the service period and is charged to offline advertising expense.
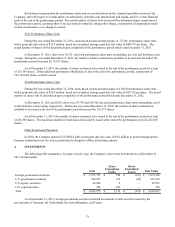
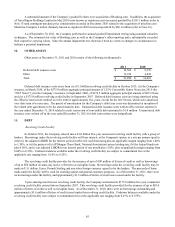
4. INVESTMENTS
The following table summarizes, by major security type, the Company’s short-term investments as of December 31,
2011 (in thousands):
Foreign government securities
U.S. government securities
U.S. agency securities
U.S. corporate notes
Total
Cost
$ 1,073,731
922,997
26,942
205
$ 2,023,875
Gross
Unrealized
Gains
$ 588
353
9
163
$ 1,113
Gross
Unrealized
Losses
$(133)
(28)
—
—
$(161)
Fair Value
$ 1,074,186
923,322
26,951
368
$ 2,024,827
As of December 31, 2011, foreign government securities included investments in debt securities issued by the
governments of Germany, the Netherlands, the United Kingdom, and France.