Priceline 2011 Annual Report Download - page 40
Download and view the complete annual report
Please find page 40 of the 2011 Priceline annual report below. You can navigate through the pages in the report by either clicking on the pages listed below, or by using the keyword search tool below to find specific information within the annual report.-
 1
1 -
2
-
3
-
4
-
5
-
6
-
7
-
8
-
9
-
10
-
11
-
12
-
13
-
14
-
15
-
16
-
17
-
18
-
19
-
20
-
21
-
22
-
23
-
24
-
25
-
26
-
27
-
28
-
29
-
 30
30 -
 31
31 -
 32
32 -
 33
33 -
 34
34 -
 35
35 -
 36
36 -
 37
37 -
 38
38 -
 39
39 -
 40
40 -
 41
41 -
 42
42 -
 43
43 -
 44
44 -
 45
45 -
 46
46 -
 47
47 -
 48
48 -
 49
49 -
 50
50 -
51
-
52
-
53
-
54
-
55
-
56
-
57
-
58
-
59
-
60
-
61
-
62
-
63
-
64
-
65
-
66
-
67
-
68
-
69
-
70
-
71
-
72
-
73
-
74
-
75
-
76
-
77
-
78
-
79
-
80
-
81
-
82
-
83
-
84
-
85
-
86
-
87
-
88
-
89
-
90
-
91
-
92
-
93
-
94
-
95
-
96
-
97
-
98
-
99
-
100
-
101
-
102
-
103
-
104
-
105
-
106
-
107
-
108
-
109
-
110
-
111
 |
 |

39
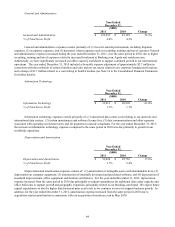
In June 2010, the FASB issued amended accounting guidance on the presentation of other comprehensive income in
financial statements by requiring comprehensive income to be reported in either a single statement or in two consecutive
statements reporting net income and other comprehensive income. This accounting update also required reclassification
adjustments out of other comprehensive income to be presented in both the income statement and the statement in which other
comprehensive income is presented, both in interim and annual periods. In December 2011, the FASB issued another
accounting update which indefinitely defers the requirement to separately present reclassification adjustments on the face of
the financial statements. During the deferral period, a company that does not display reclassification adjustments on the face of
the financial statements must disclose such adjustments in the notes to the financial statements. The accounting guidance did
not change the items that constitute net income or other comprehensive income, the timing of when other comprehensive
income is reclassified to net income, or the earnings per share computation. The accounting update requires retrospective
application. Public entities will be required to adopt the guidance for fiscal years, and interim periods within those years,
beginning after December 15, 2011, with early adoption permitted. We intend to comply with the change in presentation of
other comprehensive income in the financial statements beginning in the first quarter of 2012.
In May 2010, the FASB issued amended guidance on fair value to largely achieve common fair value measurement
and disclosure requirements between U.S. GAAP and IFRS. The new accounting guidance does not extend the use of fair
value but rather provides guidance about how fair value should be determined. For U.S. GAAP, most of the changes are
clarifications of existing guidance or wording changes to align with IFRS. Amendments that clarify the Board's intent under
existing requirements include: (a) use of the highest and best use and valuation premise concept should be limited to
nonfinancial assets; (b) disclosure should include quantitative information about the unobservable inputs used in a fair value
measurement that is categorized within Level 3 of the fair value hierarchy; and (c) the fair value of an instrument classified in
an entity's equity should be valued from the perspective of a market participant that holds that instrument as an asset. The
amended guidance changes requirements as follows: (a) disclosures are expanded, particularly those relating to fair value
measurements based on unobservable inputs, (b) fair value measurements for financial assets and liabilities based on a net
position are permitted if market or credit risks are managed on a net basis and other criteria are met, and (c) premiums and
discounts are allowed only if a market participant would also include them in the fair value measurement. This accounting
update is effective for public companies for interim or annual periods beginning after December 15, 2011, with early adoption
permitted. We expect to make the additional disclosures required in 2012.
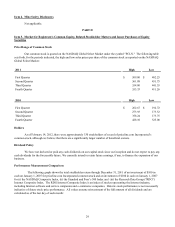
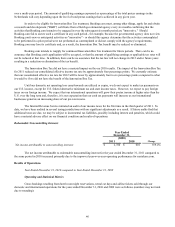
Results of Operations
Year Ended December 31, 2011 compared to Year Ended December 31, 2010
Operating and Statistical Metrics
Our financial results are driven by certain operating metrics that encompass the booking activity generated by our
travel services. Specifically, reservations of hotel room nights, rental car days and airline tickets capture the volume of units
purchased by our customers. Gross bookings is an operating and statistical metric that captures the total dollar value, generally
inclusive of taxes and fees, of all travel services booked by our customers, and is widely used in the travel business.
International gross bookings reflect gross bookings generated principally by websites owned by, operated by, or dedicated to
providing gross bookings for our international brands and operations, and domestic gross bookings reflect gross bookings
generated principally by websites owned by, operated by, or dedicated to providing gross bookings by our domestic operations,
in each case without regard to the travel destination or the location of the customer purchasing the travel.
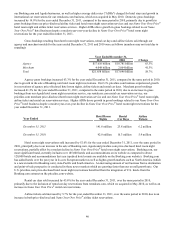
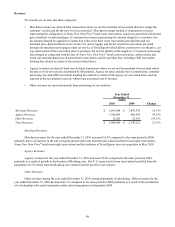
Gross bookings resulting from hotel room night reservations, rental car days and airline tickets sold through our
domestic and international operations for the years ended December 31, 2011 and 2010 were as follows (numbers may not total
due to rounding):
Domestic
International
Total
Year Ended December 31,
2011
$4.748 billion
16.909 billion
$21.658 billion
2010
$4.166 billion
9.480 billion
$13.646 billion
Change
14.0%
78.4%
58.7%
Gross bookings increased by 58.7% for the year ended December 31, 2011, compared to the same period in 2010,
principally due to 52.6% growth in hotel room night reservation. The 78.4% increase in international gross bookings (growth
on a local currency basis was approximately 70%) was attributable to growth in international hotel room night reservations for