Priceline 2011 Annual Report Download - page 42
Download and view the complete annual report
Please find page 42 of the 2011 Priceline annual report below. You can navigate through the pages in the report by either clicking on the pages listed below, or by using the keyword search tool below to find specific information within the annual report.-
 1
1 -
2
-
3
-
4
-
5
-
6
-
7
-
8
-
9
-
10
-
11
-
12
-
13
-
14
-
15
-
16
-
17
-
18
-
19
-
20
-
21
-
22
-
23
-
24
-
25
-
26
-
27
-
28
-
29
-
30
-
31
-
 32
32 -
 33
33 -
 34
34 -
 35
35 -
 36
36 -
 37
37 -
 38
38 -
 39
39 -
 40
40 -
 41
41 -
 42
42 -
 43
43 -
 44
44 -
 45
45 -
 46
46 -
 47
47 -
 48
48 -
 49
49 -
 50
50 -
 51
51 -
 52
52 -
53
-
54
-
55
-
56
-
57
-
58
-
59
-
60
-
61
-
62
-
63
-
64
-
65
-
66
-
67
-
68
-
69
-
70
-
71
-
72
-
73
-
74
-
75
-
76
-
77
-
78
-
79
-
80
-
81
-
82
-
83
-
84
-
85
-
86
-
87
-
88
-
89
-
90
-
91
-
92
-
93
-
94
-
95
-
96
-
97
-
98
-
99
-
100
-
101
-
102
-
103
-
104
-
105
-
106
-
107
-
108
-
109
-
110
-
111
 |
 |

41
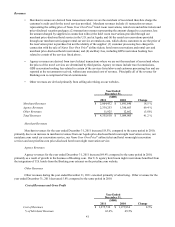
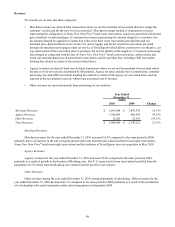
Revenues
• Merchant revenues are derived from transactions where we are the merchant of record and therefore charge the
customer's credit card for the travel services provided. Merchant revenues include (1) transaction revenues
representing the selling price of Name Your Own Price® hotel room reservations, rental cars and airline tickets and
price-disclosed vacation packages; (2) transaction revenues representing the amount charged to a customer, less
the amount charged by suppliers in connection with (a) the hotel room reservations provided through our
merchant price-disclosed hotel service in the U.S. and at Agoda, and (b) the rental car reservations provided
through our merchant semi-opaque rental car service at rentalcars.com, which allows customers to see the price of
the reservation prior to purchase but not the identity of the supplier; (3) customer processing fees charged in
connection with the sale of Name Your Own Price® airline tickets, hotel room reservations and rental cars and
merchant price-disclosed hotel reservations; and (4) ancillary fees, including GDS reservation booking fees
related to certain of the services listed above.
• Agency revenues are derived from travel related transactions where we are not the merchant of record and where
the prices of the travel services are determined by third parties. Agency revenues include travel commissions,
GDS reservation booking fees related to certain of the services listed above and customer processing fees and are
reported at the net amounts received, without any associated cost of revenue. Principally all of the revenue for
Booking.com is comprised of travel commissions.
• Other revenues are derived primarily from selling advertising on our websites.
Merchant Revenues
Agency Revenues
Other Revenues
Total Revenues
Year Ended
December 31,
($000)
2011
$ 2,004,432
2,339,253
11,925
$ 4,355,610
2010
$ 1,691,640
1,380,603
12,662
$ 3,084,905
Change
18.5 %
69.4 %
(5.8)%
41.2 %
Merchant Revenues
Merchant revenues for the year ended December 31, 2011 increased 18.5%, compared to the same period in 2010,
primarily due to an increase in merchant revenues from our Agoda price-disclosed hotel room night reservation service, our
rentalcars.com rental car reservation service, our Name Your Own Price® airline ticket and hotel room night reservation
services and our priceline.com price-disclosed hotel room night reservation service.
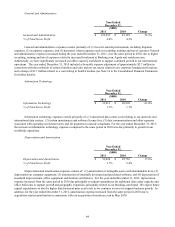
Agency Revenues
Agency revenues for the year ended December 31, 2011 increased 69.4% compared to the same period in 2010,
primarily as a result of growth in the business of Booking.com. Our U.S. agency hotel room night reservations benefited from
the integration of U.S. hotels from the Booking.com extranet on the priceline.com website.
Other Revenues
Other revenues during the year ended December 31, 2011 consisted primarily of advertising. Other revenues for the
year ended December 31, 2011 decreased 5.8% compared to the same period in 2010.
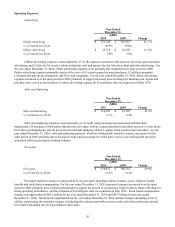
Cost of Revenues and Gross Profit
Cost of Revenues
% of Merchant Revenues
Year Ended
December 31,
($000)
2011
$ 1,275,730
63.6%
2010
$ 1,175,934
69.5%
Change
8.5%