Priceline 2011 Annual Report Download - page 45
Download and view the complete annual report
Please find page 45 of the 2011 Priceline annual report below. You can navigate through the pages in the report by either clicking on the pages listed below, or by using the keyword search tool below to find specific information within the annual report.-
 1
1 -
2
-
3
-
4
-
5
-
6
-
7
-
8
-
9
-
10
-
11
-
12
-
13
-
14
-
15
-
16
-
17
-
18
-
19
-
20
-
21
-
22
-
23
-
24
-
25
-
26
-
27
-
28
-
29
-
30
-
31
-
32
-
33
-
34
-
 35
35 -
 36
36 -
 37
37 -
 38
38 -
 39
39 -
 40
40 -
 41
41 -
 42
42 -
 43
43 -
 44
44 -
 45
45 -
 46
46 -
 47
47 -
 48
48 -
 49
49 -
 50
50 -
 51
51 -
 52
52 -
 53
53 -
 54
54 -
 55
55 -
56
-
57
-
58
-
59
-
60
-
61
-
62
-
63
-
64
-
65
-
66
-
67
-
68
-
69
-
70
-
71
-
72
-
73
-
74
-
75
-
76
-
77
-
78
-
79
-
80
-
81
-
82
-
83
-
84
-
85
-
86
-
87
-
88
-
89
-
90
-
91
-
92
-
93
-
94
-
95
-
96
-
97
-
98
-
99
-
100
-
101
-
102
-
103
-
104
-
105
-
106
-
107
-
108
-
109
-
110
-
111
 |
 |

44
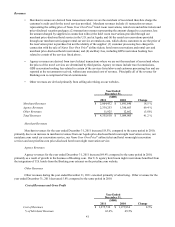
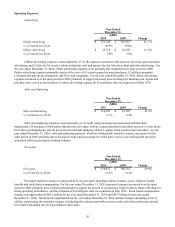
General and Administrative
General and Administrative
% of Total Gross Profit
Year Ended
December 31,
($000)
2011
$ 123,652
4.0%
2010
$ 81,185
4.3%
Change
52.3%
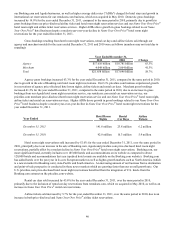
General and administrative expenses consist primarily of: (1) fees for outside professionals, including litigation
expenses; (2) occupancy expenses; and (3) personnel related expenses such as recruiting, training and travel expenses. General
and administrative expenses increased during the year ended December 31, 2011, over the same period in 2010, due to higher
recruiting, training and travel expenses related to increased headcount at Booking.com, Agoda and rentalcars.com.
Additionally, we have significantly increased our office capacity worldwide to support continued growth in our international
operations. The year ended December 31, 2010 included a favorable expense adjustment of approximately $2.7 million in
connection with the resolution of certain franchise and sales and use tax issues related to our corporate headquarters location,
and a charge of $1.7 million related to a court ruling in South Carolina (see Note 16 to the Consolidated Financial Statements
for further details).
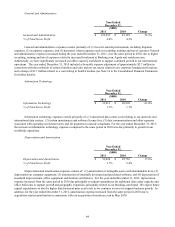
Information Technology
Information Technology
% of Total Gross Profit
Year Ended
December 31,
($000)
2011
$ 33,813
1.1%
2010
$ 20,998
1.1%
Change
61.0%
Information technology expenses consist primarily of: (1) outsourced data center costs relating to our domestic and
international data centers; (2) system maintenance and software license fees; (3) data communications and other expenses
associated with operating our Internet sites; and (4) payments to outside consultants. For the year ended December 31, 2011,
the increase in information technology expenses compared to the same period in 2010 was due primarily to growth in our
worldwide operations.
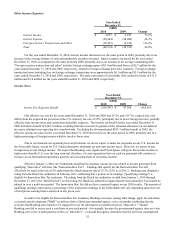
Depreciation and Amortization
Depreciation and Amortization
% of Total Gross Profit
Year Ended
December 31,
($000)
2011
$ 53,824
1.7%
2010
$ 45,763
2.4%
Change
17.6%
Depreciation and amortization expenses consist of: (1) amortization of intangible assets with determinable lives; (2)
depreciation on computer equipment; (3) amortization of internally developed and purchased software; and (4) depreciation of
leasehold improvements, office equipment and furniture and fixtures. For the year ended December 31, 2011, depreciation
expense increased from the same period in 2010 due principally to capital expenditures for additional data center capacity and
office build outs to support growth and geographic expansion, principally related to our Booking.com brand. We expect future
capital expenditures to also be higher than historical prior year levels as we continue to invest to support business growth. In
addition, for the year ended December 31, 2011, amortization expense increased from the same period in 2010 due to
acquisition-related amortization in connection with our acquisition of rentalcars.com in May 2010.