Priceline 2011 Annual Report Download - page 103
Download and view the complete annual report
Please find page 103 of the 2011 Priceline annual report below. You can navigate through the pages in the report by either clicking on the pages listed below, or by using the keyword search tool below to find specific information within the annual report.-
 1
1 -
2
-
3
-
4
-
5
-
6
-
7
-
8
-
9
-
10
-
11
-
12
-
13
-
14
-
15
-
16
-
17
-
18
-
19
-
20
-
21
-
22
-
23
-
24
-
25
-
26
-
27
-
28
-
29
-
30
-
31
-
32
-
33
-
34
-
35
-
36
-
37
-
38
-
39
-
40
-
41
-
42
-
43
-
44
-
45
-
46
-
47
-
48
-
49
-
50
-
51
-
52
-
53
-
54
-
55
-
56
-
57
-
58
-
59
-
60
-
61
-
62
-
63
-
64
-
65
-
66
-
67
-
68
-
69
-
70
-
71
-
72
-
73
-
74
-
75
-
76
-
77
-
78
-
79
-
80
-
81
-
82
-
83
-
84
-
85
-
86
-
87
-
88
-
89
-
90
-
91
-
92
-
 93
93 -
 94
94 -
 95
95 -
 96
96 -
 97
97 -
 98
98 -
 99
99 -
 100
100 -
 101
101 -
 102
102 -
 103
103 -
 104
104 -
 105
105 -
 106
106 -
 107
107 -
 108
108 -
 109
109 -
 110
110 -
 111
111
 |
 |

102
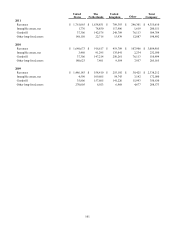
19. SELECTED QUARTERLY FINANCIAL DATA (UNAUDITED)
2011
Total revenues(1)
Gross profit
Net income
Net income applicable to common stockholders
Net income applicable to common stockholders per basic
common share
Net income applicable to common stockholders per
diluted common share
First
Quarter (In thousands, except per share data)
$ 809,320
505,808
104,013
104,790
$ 2.12
$ 2.05
Second
Quarter
$ 1,102,716
749,227
256,277
256,368
$ 5.16
$ 5.02
Third
Quarter
$ 1,452,804
1,100,148
472,886
469,499
$ 9.43
$ 9.17
Fourth
Quarter
$ 990,770
724,697
225,955
225,715
$ 4.53
$ 4.41
_____________________________
2010
Total revenues(1)
Gross profit
Net income
Net income applicable to common stockholders
Net income applicable to common stockholders per basic
common share
Net income applicable to common stockholders per
diluted common share
First
Quarter (In thousands, except per share data)
$ 584,394
319,116
53,875
53,875
$ 1.16
$ 1.06
Second
Quarter
$ 767,439
445,255
114,596
114,957
$ 2.41
$ 2.26
Third
Quarter
$ 1,001,757
666,188
224,560
222,980
$ 4.59
$ 4.41
Fourth
Quarter
$ 731,316
478,413
135,111
135,729
$ 2.76
$ 2.66
_____________________________
(1) As the Company's retail hotel business, which recognizes revenue at the completion of the stay, continues to expand,
our quarterly results become increasingly impacted by seasonal factors.