Priceline 2011 Annual Report Download - page 71
Download and view the complete annual report
Please find page 71 of the 2011 Priceline annual report below. You can navigate through the pages in the report by either clicking on the pages listed below, or by using the keyword search tool below to find specific information within the annual report.-
 1
1 -
2
-
3
-
4
-
5
-
6
-
7
-
8
-
9
-
10
-
11
-
12
-
13
-
14
-
15
-
16
-
17
-
18
-
19
-
20
-
21
-
22
-
23
-
24
-
25
-
26
-
27
-
28
-
29
-
30
-
31
-
32
-
33
-
34
-
35
-
36
-
37
-
38
-
39
-
40
-
41
-
42
-
43
-
44
-
45
-
46
-
47
-
48
-
49
-
50
-
51
-
52
-
53
-
54
-
55
-
56
-
57
-
58
-
59
-
60
-
 61
61 -
 62
62 -
 63
63 -
 64
64 -
 65
65 -
 66
66 -
 67
67 -
 68
68 -
 69
69 -
 70
70 -
 71
71 -
 72
72 -
 73
73 -
 74
74 -
 75
75 -
 76
76 -
 77
77 -
 78
78 -
 79
79 -
 80
80 -
 81
81 -
82
-
83
-
84
-
85
-
86
-
87
-
88
-
89
-
90
-
91
-
92
-
93
-
94
-
95
-
96
-
97
-
98
-
99
-
100
-
101
-
102
-
103
-
104
-
105
-
106
-
107
-
108
-
109
-
110
-
111
 |
 |

70
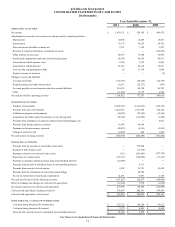
priceline.com Incorporated
CONSOLIDATED STATEMENTS OF CHANGES IN STOCKHOLDERS’ EQUITY
FOR THE YEARS ENDED DECEMBER 31, 2011, 2010 and 2009
(In thousands)
Balance, December 31, 2008
Net income applicable to common stockholders
Unrealized gain on marketable securities, net of tax of $0
Currency translation adjustment, net of tax of $1,209
Comprehensive income
Restricted stock forfeitures
Reclassification adjustment for convertible debt in mezzanine
Exercise of stock options & vesting of restricted stock units and/or performance share units
Repurchase of common stock
Stock-based compensation and other stock based payments
Conversion of debt
Excess tax benefit from stock—based compensation
Balance, December 31, 2009
Net income applicable to common stockholders
Redeemable noncontrolling interests fair value adjustment
Unrealized gain on marketable securities, net of tax of $175
Currency translation adjustment, net of tax of $11,311
Comprehensive income
Redeemable noncontrolling interests fair value adjustments
Proceeds from the termination of conversion spread hedges
Reclassification adjustment for convertible debt in mezzanine
Exercise of stock options & vesting of restricted stock units and/or performance share units
Repurchase of common stock
Stock-based compensation and other stock—based payments
Issuance of senior convertible notes
Conversion of debt
Excess tax benefit from stock—based compensation
Balance, December 31, 2010
Net income applicable to common stockholders
Unrealized gain on marketable securities, net of tax of $96
Currency translation adjustment, net of tax of $21,547
Comprehensive income
Redeemable noncontrolling interests fair value adjustments
Reclassification adjustment for convertible debt in mezzanine
Exercise of stock options & vesting of restricted stock units and/or performance share units
Repurchase of common stock
Stock-based compensation and other stock—based payments
Conversion of debt
Excess tax benefit from stock—based compensation
Balance, December 31, 2011
Common Stock
Shares
47,665
—
—
—
(3)
—
1,200
—
—
3,584
—
52,446
—
—
—
—
—
—
663
—
—
—
3,458
—
56,567
—
—
—
—
—
1,007
—
—
5
—
57,579
Amount
$ 367
—
—
—
—
—
9
—
—
29
—
$ 405
—
—
—
—
—
—
5
—
—
—
28
—
$ 438
—
—
—
—
—
8
—
—
—
—
$ 446
Treasury Stock
Shares
(6,685)
—
—
—
—
—
—
(180)
—
—
—
(6,865)
—
—
—
—
—
—
—
(556)
—
—
—
—
(7,421)
—
—
—
—
—
—
(359)
—
—
—
(7,780)
Amount
$(493,555)
—
—
—
—
—
—
(17,415)
—
—
—
$(510,970)
—
—
—
—
—
—
—
(129,445)
—
—
—
—
$(640,415)
—
—
—
—
—
—
(163,171)
—
—
—
$(803,586)
Additional
Paid-in
Capital
$ 2,176,556
—
—
—
—
18,203
43,419
—
40,671
8,869
2,149
$ 2,289,867
—
—
—
—
(4,118)
42,984
3,683
25,746
—
68,396
67,516
(80,073)
3,091
$ 2,417,092
—
—
—
—
(77,342)
4,294
—
66,194
—
21,041
$ 2,431,279
Accumulated
Earnings
(Deficit)
$ (944,145)
489,472
—
—
—
—
—
—
—
—
—
$ (454,673)
527,541
(3,758)
—
—
—
—
—
—
—
—
—
—
$ 69,110
1,056,371
—
—
(91,743)
—
—
—
—
—
—
$ 1,033,738
Accumulated
Other
Comprehensive
Loss
$ (40,397)
—
116
37,281
—
—
—
—
—
—
—
$ (3,000)
—
—
294
(30,183)
—
—
—
—
—
—
—
—
$ (32,889)
—
212
(54,905)
—
—
—
—
—
—
—
$ (87,582)
Comprehensive
Income
$ 489,472
116
37,281
$ 526,869
$ 527,541
(3,758)
294
(30,183)
$ 493,894
$ 1,056,371
212
(54,905)
$ 1,001,678
Total
$ 698,826
526,869
—
18,203
43,428
(17,415)
40,671
8,898
2,149
$ 1,321,629
493,894
(4,118)
42,984
3,683
25,751
(129,445)
68,396
67,516
(80,045)
3,091
$ 1,813,336
1,001,678
(91,743)
(77,342)
4,302
(163,171)
66,194
—
21,041
$ 2,574,295
See Notes to Consolidated Financial Statements.