Priceline 2011 Annual Report Download - page 69
Download and view the complete annual report
Please find page 69 of the 2011 Priceline annual report below. You can navigate through the pages in the report by either clicking on the pages listed below, or by using the keyword search tool below to find specific information within the annual report.-
 1
1 -
2
-
3
-
4
-
5
-
6
-
7
-
8
-
9
-
10
-
11
-
12
-
13
-
14
-
15
-
16
-
17
-
18
-
19
-
20
-
21
-
22
-
23
-
24
-
25
-
26
-
27
-
28
-
29
-
30
-
31
-
32
-
33
-
34
-
35
-
36
-
37
-
38
-
39
-
40
-
41
-
42
-
43
-
44
-
45
-
46
-
47
-
48
-
49
-
50
-
51
-
52
-
53
-
54
-
55
-
56
-
57
-
58
-
 59
59 -
 60
60 -
 61
61 -
 62
62 -
 63
63 -
 64
64 -
 65
65 -
 66
66 -
 67
67 -
 68
68 -
 69
69 -
 70
70 -
 71
71 -
 72
72 -
 73
73 -
 74
74 -
 75
75 -
 76
76 -
 77
77 -
 78
78 -
 79
79 -
80
-
81
-
82
-
83
-
84
-
85
-
86
-
87
-
88
-
89
-
90
-
91
-
92
-
93
-
94
-
95
-
96
-
97
-
98
-
99
-
100
-
101
-
102
-
103
-
104
-
105
-
106
-
107
-
108
-
109
-
110
-
111
 |
 |

68
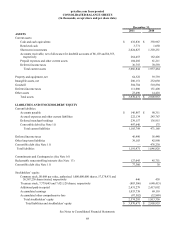
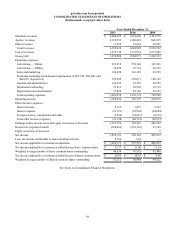
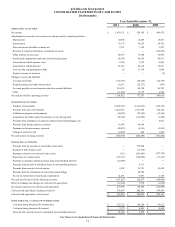
priceline.com Incorporated
CONSOLIDATED BALANCE SHEETS
(In thousands, except share and per share data)
ASSETS
Current assets:
Cash and cash equivalents
Restricted cash
Short-term investments
Accounts receivable, net of allowance for doubtful accounts of $6,103 and $6,353,
respectively
Prepaid expenses and other current assets
Deferred income taxes
Total current assets
Property and equipment, net
Intangible assets, net
Goodwill
Deferred income taxes
Other assets
Total assets
LIABILITIES AND STOCKHOLDERS’ EQUITY
Current liabilities:
Accounts payable
Accrued expenses and other current liabilities
Deferred merchant bookings
Convertible debt (See Note 11)
Total current liabilities
Deferred income taxes
Other long-term liabilities
Convertible debt (See Note 11)
Total liabilities
Commitments and Contingencies (See Note 16)
Redeemable noncontrolling interests (See Note 13)
Convertible debt (See Note 11)
Stockholders’ equity:
Common stock, $0.008 par value, authorized 1,000,000,000 shares, 57,578,431 and
56,567,236 shares issued, respectively
Treasury stock, 7,779,645 and 7,421,128 shares, respectively
Additional paid-in capital
Accumulated earnings
Accumulated other comprehensive loss
Total stockholders’ equity
Total liabilities and stockholders’ equity
December 31,
2011
$ 632,836
3,771
2,024,827
264,453
104,202
36,755
3,066,844
64,322
200,151
504,784
111,080
23,490
$ 3,970,671
$ 146,867
222,134
239,157
497,640
1,105,798
46,990
39,183
—
1,191,971
127,045
77,360
446
(803,586)
2,431,279
1,033,738
(87,582)
2,574,295
$ 3,970,671
2010
$ 358,967
1,050
1,303,251
162,426
61,211
70,559
1,957,464
39,739
232,030
510,894
151,408
14,418
$ 2,905,953
$ 90,311
243,767
136,915
175
471,168
56,440
42,990
476,230
1,046,828
45,751
38
438
(640,415)
2,417,092
69,110
(32,889)
1,813,336
$ 2,905,953
See Notes to Consolidated Financial Statements.