Priceline 2011 Annual Report Download - page 70
Download and view the complete annual report
Please find page 70 of the 2011 Priceline annual report below. You can navigate through the pages in the report by either clicking on the pages listed below, or by using the keyword search tool below to find specific information within the annual report.-
 1
1 -
2
-
3
-
4
-
5
-
6
-
7
-
8
-
9
-
10
-
11
-
12
-
13
-
14
-
15
-
16
-
17
-
18
-
19
-
20
-
21
-
22
-
23
-
24
-
25
-
26
-
27
-
28
-
29
-
30
-
31
-
32
-
33
-
34
-
35
-
36
-
37
-
38
-
39
-
40
-
41
-
42
-
43
-
44
-
45
-
46
-
47
-
48
-
49
-
50
-
51
-
52
-
53
-
54
-
55
-
56
-
57
-
58
-
59
-
 60
60 -
 61
61 -
 62
62 -
 63
63 -
 64
64 -
 65
65 -
 66
66 -
 67
67 -
 68
68 -
 69
69 -
 70
70 -
 71
71 -
 72
72 -
 73
73 -
 74
74 -
 75
75 -
 76
76 -
 77
77 -
 78
78 -
 79
79 -
 80
80 -
81
-
82
-
83
-
84
-
85
-
86
-
87
-
88
-
89
-
90
-
91
-
92
-
93
-
94
-
95
-
96
-
97
-
98
-
99
-
100
-
101
-
102
-
103
-
104
-
105
-
106
-
107
-
108
-
109
-
110
-
111
 |
 |

69
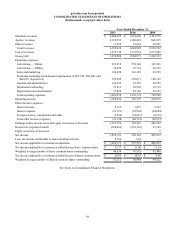
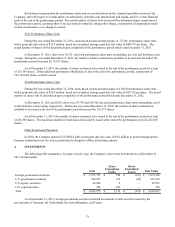
priceline.com Incorporated
CONSOLIDATED STATEMENTS OF OPERATIONS
(In thousands, except per share data)
Merchant revenues
Agency revenues
Other revenues
Total revenues
Cost of revenues
Gross profit
Operating expenses:
Advertising — Online
Advertising — Offline
Sales and marketing
Personnel, including stock-based compensation of $65,724, $68,200, and
$40,671, respectively
General and administrative
Information technology
Depreciation and amortization
Total operating expenses
Operating income
Other income (expense):
Interest income
Interest expense
Foreign currency transactions and other
Total other income (expense)
Earnings before income taxes and equity in income of investees
Income tax (expense) benefit
Equity in income of investees
Net income
Less: net income attributable to noncontrolling interests
Net income applicable to common stockholders
Net income applicable to common stockholders per basic common share
Weighted average number of basic common shares outstanding
Net income applicable to common stockholders per diluted common share
Weighted average number of diluted common shares outstanding
Year Ended December 31,
2011
$ 2,004,432
2,339,253
11,925
4,355,610
1,275,730
3,079,880
919,214
35,470
162,690
352,295
123,652
33,813
53,824
1,680,958
1,398,922
8,119
(31,721)
(7,526)
(31,128)
1,367,794
(308,663)
—
1,059,131
2,760
$ 1,056,371
$ 21.27
49,654
$ 20.63
51,211
2010
$ 1,691,640
1,380,603
12,662
3,084,905
1,175,934
1,908,971
552,140
35,714
116,303
270,071
81,185
20,998
45,763
1,122,174
786,797
3,857
(29,944)
(14,427)
(40,514)
746,283
(218,141)
—
528,142
601
$ 527,541
$ 11.00
47,955
$ 10.35
50,988
2009
$ 1,447,576
868,395
22,241
2,338,212
1,077,449
1,260,763
365,381
36,270
81,238
180,152
68,555
19,139
39,193
789,928
470,835
2,223
(24,084)
(6,672)
(28,533)
442,302
47,168
2
489,472
—
$ 489,472
$ 11.54
42,406
$ 9.88
49,522
See Notes to Consolidated Financial Statements.