Pfizer 2011 Annual Report Download - page 92
Download and view the complete annual report
Please find page 92 of the 2011 Pfizer annual report below. You can navigate through the pages in the report by either clicking on the pages listed below, or by using the keyword search tool below to find specific information within the annual report.-
 1
1 -
2
-
3
-
4
-
5
-
6
-
7
-
8
-
9
-
10
-
11
-
12
-
13
-
14
-
15
-
16
-
17
-
18
-
19
-
20
-
21
-
22
-
23
-
24
-
25
-
26
-
27
-
28
-
29
-
30
-
31
-
32
-
33
-
34
-
35
-
36
-
37
-
38
-
39
-
40
-
41
-
42
-
43
-
44
-
45
-
46
-
47
-
48
-
49
-
50
-
51
-
52
-
53
-
54
-
55
-
56
-
57
-
58
-
59
-
60
-
61
-
62
-
63
-
64
-
65
-
66
-
67
-
68
-
69
-
70
-
71
-
72
-
73
-
74
-
75
-
76
-
77
-
78
-
79
-
80
-
81
-
 82
82 -
 83
83 -
 84
84 -
 85
85 -
 86
86 -
 87
87 -
 88
88 -
 89
89 -
 90
90 -
 91
91 -
 92
92 -
 93
93 -
 94
94 -
 95
95 -
 96
96 -
 97
97 -
 98
98 -
 99
99 -
 100
100 -
 101
101 -
 102
102 -
103
-
104
-
105
-
106
-
107
-
108
-
109
-
110
-
111
-
112
-
113
-
114
-
115
-
116
-
117
 |
 |

Notes to Consolidated Financial Statements
Pfizer Inc. and Subsidiary Companies
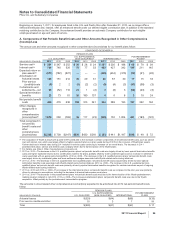
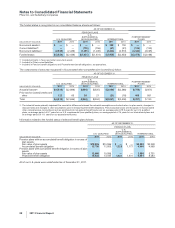
We utilize long-term asset allocation ranges in the management of our plans’ invested assets. Our long-term return expectations are
developed based on a diversified, global investment strategy that takes into account historical experience, as well as the impact of
portfolio diversification, active portfolio management, and our view of current and future economic and financial market conditions.
As market conditions and other factors change, we may adjust our targets accordingly and our asset allocations may vary from the
target allocations.
Our long-term asset allocation ranges reflect our asset class return expectations and tolerance for investment risk within the context
of the respective plans’ long-term benefit obligations. These ranges are supported by analysis that incorporates historical and
expected returns by asset class, as well as volatilities and correlations across asset classes and our liability profile. This analysis,
referred to as an asset-liability analysis, also provides an estimate of expected returns on plan assets, as well as a forecast of
potential future asset and liability balances.
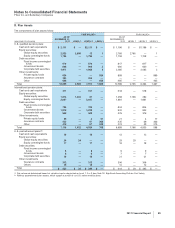
The plans’ assets are managed with the objectives of minimizing pension expense and cash contributions over the long term. Asset
liability studies are performed periodically in order to support asset allocations.
The investment managers of each separately managed account are permitted to use derivative securities as described in their
investment management agreements.
Investment performance is reviewed on a monthly basis in total, as well as by asset class and individual manager, relative to one or
more benchmarks. Investment performance and detailed statistical analysis of both investment performance and portfolio holdings
are conducted, a large portion of which is presented to senior management on a quarterly basis. Periodic formal meetings are held
with each investment manager to review the investments.
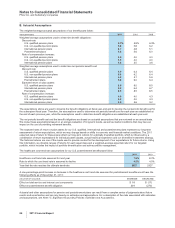
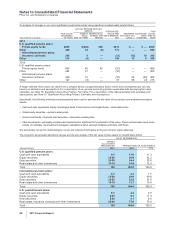
E. Cash Flows
It is our practice to fund amounts for our qualified pension plans that are at least sufficient to meet the minimum requirements set
forth in applicable employee benefit laws and local tax laws.
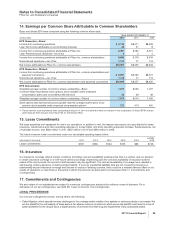
The expected future cash flow information related to our benefit plans follows:
PENSION PLANS
(MILLIONS OF DOLLARS)
U.S.
QUALIFIED
U.S.
SUPPLEMENTAL
(NON-QUALIFIED) INTERNATIONAL
POST
RETIREMENT
PLANS
Expected employer contributions:
2012 $ 19 $130 $ 431 $ 394
Expected benefit payments:
2012 $ 874 $130 $ 394 $ 295
2013 806 173 403 308
2014 825 174 416 317
2015 819 165 436 326
2016 839 141 455 331
2017–2021 4,891 706 2,496 1,780
The table reflects the total U.S. and international plan benefits projected to be paid from the plans or from our general assets under
the current actuarial assumptions used for the calculation of the benefit obligation and, therefore, actual benefit payments may differ
from projected benefit payments.
F. Defined Contribution Plans
We have savings and investment plans in several countries, including the U.S., U.K., Japan, Spain and the Netherlands. For the
U.S. plans, employees may contribute a portion of their salaries and bonuses to the plans, and we match, largely in company stock
or company stock units, a portion of the employee contributions. In the U.S., the matching contributions in company stock are
sourced through open market purchases. Employees are permitted to subsequently diversify all or any portion of their company
matching contribution. The contribution match for certain legacy Pfizer U.S. participants is held in an employee stock ownership
plan. We recorded charges related to our plans of $288 million in 2011, $259 million in 2010 and $191 million in 2009.
12. Equity
A. Common Stock
During 2009, in connection with our acquisition of Wyeth on October 15, 2009, we issued approximately 1.3 billion shares of
common stock, which were previously held as Pfizer treasury stock, to former Wyeth shareholders to partially fund the acquisition.
The excess of the average cost of Pfizer treasury stock issued over the fair value of the stock portion of the consideration transferred
to acquire Wyeth was recorded as a reduction to Retained Earnings. We purchase our common stock via privately negotiated
transactions or in open market purchases as circumstances and prices warrant. Purchased shares under each of the share-
purchase plans, which are authorized by our Board of Directors, are available for general corporate purposes.
From June 2005 through year-end 2011, we purchased approximately 1.2 billion shares of our stock for approximately $28 billion.
On February 1, 2011, we announced that the Board of Directors authorized a new $5 billion share-purchase plan. On December 12,
2011, we announced that the Board of Directors authorized an additional $10 billion share-purchase plan. In 2011, we purchased
2011 Financial Report 91