Pfizer 2011 Annual Report Download - page 89
Download and view the complete annual report
Please find page 89 of the 2011 Pfizer annual report below. You can navigate through the pages in the report by either clicking on the pages listed below, or by using the keyword search tool below to find specific information within the annual report.-
 1
1 -
2
-
3
-
4
-
5
-
6
-
7
-
8
-
9
-
10
-
11
-
12
-
13
-
14
-
15
-
16
-
17
-
18
-
19
-
20
-
21
-
22
-
23
-
24
-
25
-
26
-
27
-
28
-
29
-
30
-
31
-
32
-
33
-
34
-
35
-
36
-
37
-
38
-
39
-
40
-
41
-
42
-
43
-
44
-
45
-
46
-
47
-
48
-
49
-
50
-
51
-
52
-
53
-
54
-
55
-
56
-
57
-
58
-
59
-
60
-
61
-
62
-
63
-
64
-
65
-
66
-
67
-
68
-
69
-
70
-
71
-
72
-
73
-
74
-
75
-
76
-
77
-
78
-
 79
79 -
 80
80 -
 81
81 -
 82
82 -
 83
83 -
 84
84 -
 85
85 -
 86
86 -
 87
87 -
 88
88 -
 89
89 -
 90
90 -
 91
91 -
 92
92 -
 93
93 -
 94
94 -
 95
95 -
 96
96 -
 97
97 -
 98
98 -
 99
99 -
100
-
101
-
102
-
103
-
104
-
105
-
106
-
107
-
108
-
109
-
110
-
111
-
112
-
113
-
114
-
115
-
116
-
117
 |
 |

Notes to Consolidated Financial Statements
Pfizer Inc. and Subsidiary Companies
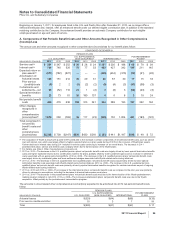
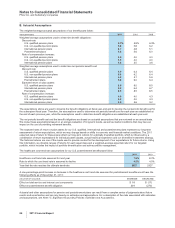
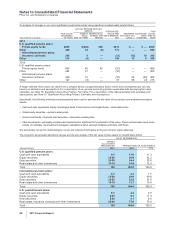
The funded status is recognized in our consolidated balance sheets as follows:
AS OF DECEMBER 31,
PENSION PLANS
U.S. QUALIFIED
U.S.
SUPPLEMENTAL
(NON-QUALIFIED) INTERNATIONAL
POSTRETIREMENT
PLANS
(MILLIONS OF DOLLARS) 2011 2010 2011 2010 2011 2010 2011 2010
Noncurrent assets(a) $—$— $—$— $ 329 $ 118 $—$—
Current liabilities(b) ——(130) (156) (41) (41) (134) (133)
Noncurrent liabilities(c) (2,830) (2,439) (1,301) (1,245) (2,224) (2,510) (3,344) (3,035)
Funded status $(2,830) $(2,439) $(1,431) $(1,401) $(1,936) $(2,433) $(3,478) $(3,168)
(a) Included primarily in Taxes and other noncurrent assets.
(b) Included in Other current liabilities.
(c) Included in Pension benefit obligations and Postretirement benefit obligations, as appropriate.
The components of amounts recognized in Accumulated other comprehensive income/(loss) follow:
AS OF DECEMBER 31,
PENSION PLANS
U.S. QUALIFIED
U.S.
SUPPLEMENTAL
(NON-QUALIFIED) INTERNATIONAL
POSTRETIREMENT
PLANS
(MILLIONS OF DOLLARS) 2011 2010 2011 2010 2011 2010 2011 2010
Actuarial losses(a) $(4,638) $(2,699) $(566) $(525) $(2,020) $(2,388) $(759) $(451)
Prior service (costs)/credits and
other 123 63 26 21 (21) (18) 468 581
Total $(4,515) $(2,636) $(540) $(504) $(2,041) $(2,406) $(291) $ 130
(a) The actuarial losses primarily represent the cumulative difference between the actuarial assumptions and actual return on plan assets, changes in
discount rates and changes in other assumptions used in measuring the benefit obligations. These actuarial losses are recognized in Accumulated
other comprehensive income/(loss) and are amortized into net periodic benefit costs over an average period of 9.9 years for our U.S. qualified
plans, an average period of 9.7 years for our U.S. supplemental (non-qualified) plans, an average period of 14 years for our international plans and
an average period of 11.1 years for our postretirement plans.
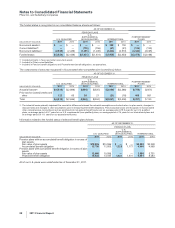
Information related to the funded status of selected benefit plans follows:
AS OF DECEMBER 31,
PENSION PLANS
U.S. QUALIFIED
U.S.
SUPPLEMENTAL
(NON-QUALIFIED) INTERNATIONAL
(MILLIONS OF DOLLARS) 2011 2010 2011 2010 2011 2010
Pension plans with an accumulated benefit obligation in excess of
plan assets:
Fair value of plan assets $12,005 $10,596 $— $— $2,529 $2,228
Accumulated benefit obligation 13,799 11,953 1,225 1,177 4,446 4,069
Pension plans with a projected benefit obligation in excess of plan
assets:
Fair value of plan assets 12,005 10,596 ——2,686 5,731
Projected benefit obligation 14,835 13,035 1,431 1,401 4,951 8,283
All of our U.S. plans were underfunded as of December 31, 2011.
88 2011 Financial Report