Pfizer 2011 Annual Report Download - page 12
Download and view the complete annual report
Please find page 12 of the 2011 Pfizer annual report below. You can navigate through the pages in the report by either clicking on the pages listed below, or by using the keyword search tool below to find specific information within the annual report.-
 1
1 -
 2
2 -
 3
3 -
 4
4 -
 5
5 -
 6
6 -
 7
7 -
 8
8 -
 9
9 -
 10
10 -
 11
11 -
 12
12 -
 13
13 -
 14
14 -
 15
15 -
 16
16 -
 17
17 -
 18
18 -
 19
19 -
 20
20 -
 21
21 -
 22
22 -
23
-
24
-
25
-
26
-
27
-
28
-
29
-
30
-
31
-
32
-
33
-
34
-
35
-
36
-
37
-
38
-
39
-
40
-
41
-
42
-
43
-
44
-
45
-
46
-
47
-
48
-
49
-
50
-
51
-
52
-
53
-
54
-
55
-
56
-
57
-
58
-
59
-
60
-
61
-
62
-
63
-
64
-
65
-
66
-
67
-
68
-
69
-
70
-
71
-
72
-
73
-
74
-
75
-
76
-
77
-
78
-
79
-
80
-
81
-
82
-
83
-
84
-
85
-
86
-
87
-
88
-
89
-
90
-
91
-
92
-
93
-
94
-
95
-
96
-
97
-
98
-
99
-
100
-
101
-
102
-
103
-
104
-
105
-
106
-
107
-
108
-
109
-
110
-
111
-
112
-
113
-
114
-
115
-
116
-
117
 |
 |

Financial Review
Pfizer Inc. and Subsidiary Companies
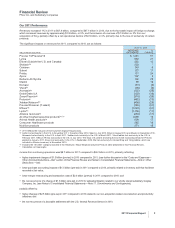
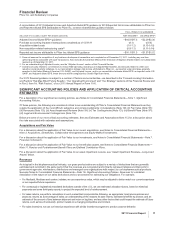
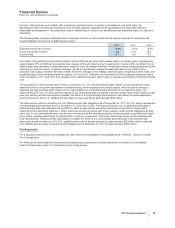
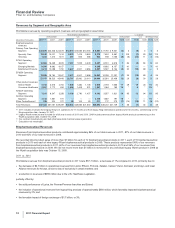
A reconciliation of 2012 Adjusted income and Adjusted diluted EPS guidance to 2012 Reported Net income attributable to Pfizer Inc.
and Reported diluted EPS attributable to Pfizer Inc. common shareholders guidance follows:
FULL-YEAR 2012 GUIDANCE
(BILLIONS OF DOLLARS, EXCEPT PER SHARE AMOUNTS) NET INCOME(a) DILUTED EPS(a)
Adjusted income/diluted EPS(b) guidance ~$16.5-$17.3 ~$2.20-$2.30
Purchase accounting impacts of transactions completed as of 12/31/11 (4.1) (0.54)
Acquisition-related costs (1.0-1.2) (0.13-0.15)
Non-acquisition-related restructuring costs(c) (0.9-1.1) (0.11-0.14)
Reported net income attributable to Pfizer Inc./diluted EPS guidance ~$10.1-$11.3 ~$1.37-$1.52
(a) Does not assume the completion of any business-development transactions not completed as of December 31, 2011, including any one-time
upfront payments associated with such transactions. Also excludes the potential effects of the resolution of litigation-related matters not substantially
resolved as of December 31, 2011.
(b) For an understanding of Adjusted income, see the “Adjusted Income” section of this Financial Review.
(c) Includes amounts related to our initiatives to reduce R&D spending, including our realigned R&D footprint, and amounts related to other cost-
reduction and productivity initiatives. In our reconciliation between Net income attributable to Pfizer Inc., as reported under principles generally
accepted in the United States of America (U.S. GAAP), and Adjusted income, and in our reconciliation between diluted EPS, as reported under U.S.
GAAP, and Adjusted diluted EPS, these amounts will be categorized as Certain Significant Items.
Our 2012 financial guidance is subject to a number of factors and uncertainties—as described in the “Forward-Looking Information
and Factors That May Affect Future Results”, “Our Operating Environment” and “Our Strategy” sections of this Financial Review and
in Part I, Item 1A, “Risk Factors”, of our 2011 Annual Report on Form 10-K.
SIGNIFICANT ACCOUNTING POLICIES AND APPLICATION OF CRITICAL ACCOUNTING
ESTIMATES
For a description of our significant accounting policies, see Notes to Consolidated Financial Statements––Note 1. Significant
Accounting Policies.
Of these policies, the following are considered critical to an understanding of Pfizer’s Consolidated Financial Statements as they
require the application of the most difficult, subjective and complex judgments: (i) Acquisitions (Note 1D); (ii) Fair Value (Note 1E);
(iii) Revenues (Note 1G); (iv) Asset Impairment Reviews (Note 1K); (v) Tax Contingencies (Note 1O); (vi) Benefit Plans (Note 1P);
(vii) Legal and Environmental Contingencies (Note 1Q).
Below are some of our more critical accounting estimates. See also Estimates and Assumptions (Note 1C) for a discussion about
the risks associated with estimates and assumptions.
Acquisitions and Fair Value
For a discussion about the application of Fair Value to our recent acquisitions, see Notes to Consolidated Financial Statements—
Note 2. Acquisitions, Divestitures, Collaborative Arrangements and Equity-Method Investments.
For a discussion about the application of Fair Value to our investments, see Notes to Consolidated Financial Statements—Note 7.
Financial Instruments.
For a discussion about the application of Fair Value to our benefit plan assets, see Notes to Consolidated Financial Statements––
Note 11. Pension and Postretirement Benefit Plans and Defined Contribution Plans.
For a discussion about the application of Fair Value to our asset impairment reviews, see “Asset Impairment Reviews––Long-Lived
Assets” below.
Revenues
As is typical in the biopharmaceutical industry, our gross product sales are subject to a variety of deductions that are generally
estimated and recorded in the same period that the revenues are recognized and primarily represent rebates and discounts to
government agencies, wholesalers, distributors and managed care organizations with respect to our biopharmaceutical products.
See also Notes to Consolidated Financial Statements––Note 1G. Significant Accounting Policies: Revenues for a detailed
description of the nature of our sales deductions and our procedures for estimating our obligations. For example,
•For Medicaid, Medicare and contract rebates, we use experience ratios, which may be adjusted to better match our current experience
or our expected future experience.
•For contractual or legislatively mandated deductions outside of the U.S., we use estimated allocation factors, based on historical
payments and some third-party reports, to project the expected level of reimbursement.
•For sales returns, we perform calculations in each market that incorporate the following, as appropriate: local returns policies and
practices; returns as a percentage of sales; an understanding of the reasons for past returns; estimated shelf life by product; and an
estimate of the amount of time between shipment and return or lag time; and any other factors that could impact the estimate of future
returns, such as loss of exclusivity, product recalls or a changing competitive environment.
•For sales incentives, we use our historical experience with similar incentives programs to predict customer behavior.
2011 Financial Report 11