Pfizer 2011 Annual Report Download - page 19
Download and view the complete annual report
Please find page 19 of the 2011 Pfizer annual report below. You can navigate through the pages in the report by either clicking on the pages listed below, or by using the keyword search tool below to find specific information within the annual report.-
 1
1 -
2
-
3
-
4
-
5
-
6
-
7
-
8
-
 9
9 -
 10
10 -
 11
11 -
 12
12 -
 13
13 -
 14
14 -
 15
15 -
 16
16 -
 17
17 -
 18
18 -
 19
19 -
 20
20 -
 21
21 -
 22
22 -
 23
23 -
 24
24 -
 25
25 -
 26
26 -
 27
27 -
 28
28 -
 29
29 -
30
-
31
-
32
-
33
-
34
-
35
-
36
-
37
-
38
-
39
-
40
-
41
-
42
-
43
-
44
-
45
-
46
-
47
-
48
-
49
-
50
-
51
-
52
-
53
-
54
-
55
-
56
-
57
-
58
-
59
-
60
-
61
-
62
-
63
-
64
-
65
-
66
-
67
-
68
-
69
-
70
-
71
-
72
-
73
-
74
-
75
-
76
-
77
-
78
-
79
-
80
-
81
-
82
-
83
-
84
-
85
-
86
-
87
-
88
-
89
-
90
-
91
-
92
-
93
-
94
-
95
-
96
-
97
-
98
-
99
-
100
-
101
-
102
-
103
-
104
-
105
-
106
-
107
-
108
-
109
-
110
-
111
-
112
-
113
-
114
-
115
-
116
-
117
 |
 |

Financial Review
Pfizer Inc. and Subsidiary Companies
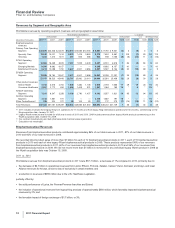
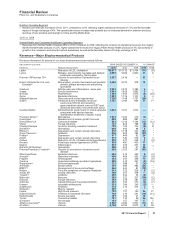
Revenues by Segment and Geographic Area
Worldwide revenues by operating segment, business unit and geographic area follow:
YEAR ENDED DECEMBER 31, % CHANGE
WORLDWIDE U.S. INTERNATIONAL WORLDWIDE U.S. INTERNATIONAL
(MILLIONS OF DOLLARS) 2011(a), (b) 2010(b) 2009(b) 2011(a), (b) 2010(b) 2009(b) 2011(a), (b) 2010(b) 2009(b) 11/10 10/09 11/10 10/09 11/10 10/09
Biopharmaceutical
revenues:
Primary Care Operating
Segment $22,670 $23,328 $22,576 $12,819 $13,536 $13,045 $ 9,851 $ 9,792 $ 9,531 (3) 3(5) 413
Specialty Care 15,245 15,021 7,414 6,870 7,419 3,853 8,375 7,602 3,561 1103 (7) 93 10 113
Oncology 1,323 1,414 1,511 391 506 456 932 908 1,055 (6) (6) (23) 11 3(14)
SC&O Operating
Segment 16,568 16,435 8,925 7,261 7,925 4,309 9,307 8,510 4,616 184 (8) 84 984
Emerging Markets 9,295 8,662 6,157 ———9,295 8,662 6,157 741 ——741
Established Products 9,214 10,098 7,790 3,627 4,501 2,656 5,587 5,597 5,134 (9) 30 (19) 69 —9
EP&EM Operating
Segment 18,509 18,760 13,947 3,627 4,501 2,656 14,882 14,259 11,291 (1) 35 (19) 69 426
57,747 58,523 45,448 23,707 25,962 20,010 34,040 32,561 25,438 (1) 29 (9) 30 528
Other product revenues:
Animal Health 4,184 3,575 2,764 1,648 1,382 1,106 2,536 2,193 1,658 17 29 19 25 16 32
Consumer Healthcare 3,057 2,772 494 1,490 1,408 331 1,567 1,364 163 10 *6*15 *
AH&CH Operating
Segment 7,241 6,347 3,258 3,138 2,790 1,437 4,103 3,557 1,821 14 95 12 94 15 95
Nutrition Operating
Segment 2,138 1,867 191 ———2,138 1,867 191 15 *——15 *
Pfizer CentreSource(c) 299 320 372 88 103 93 211 217 279 (7) (14) (15) 11 (3) (22)
Total Revenues $67,425 $67,057 $49,269 $26,933 $28,855 $21,540 $40,492 $38,202 $27,729 136 (7) 34 638
(a) 2011 includes revenues from legacy King U.S. operations for 11 months and from legacy King international operations for ten months, commencing on the
King acquisition date, January 31, 2011.
(b) Legacy Wyeth revenues are included for a full year in each of 2011 and 2010. 2009 includes revenues from legacy Wyeth products commencing on the
Wyeth acquisition date, October 15, 2009.
(c) Our contract manufacturing and bulk pharmaceutical chemical sales organization.
* Calculation not meaningful.
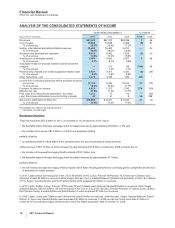
Biopharmaceutical Revenues
Revenues from biopharmaceutical products contributed approximately 86% of our total revenues in 2011, 87% of our total revenues in
2010 and 92% of our total revenues in 2009.
We recorded direct product sales of more than $1 billion for each of 12 biopharmaceutical products in 2011, each of 15 biopharmaceutical
products in 2010 and each of nine legacy Pfizer biopharmaceutical products in 2009. These products represented 56% of our revenues
from biopharmaceutical products in 2011, 60% of our revenues from biopharmaceutical products in 2010 and 56% of our revenues from
biopharmaceutical products in 2009. We did not record more than $1 billion in revenues for any individual legacy Wyeth product in 2009 as
the Wyeth acquisition date was October 15, 2009.
2011 vs. 2010
Worldwide revenues from biopharmaceutical products in 2011 were $57.7 billion, a decrease of 1% compared to 2010, primarily due to:
•the decrease of $4.7 billion in operational revenues from Lipitor, Effexor, Protonix, Xalatan, Caduet, Vfend, Aromasin and Zosyn, and lower
Alliance revenues for Aricept, all due to loss of exclusivity in certain markets; and
•a reduction in revenues of $359 million due to the U.S. Healthcare Legislation,
partially offset by:
•the solid performance of Lyrica, the Prevnar/Prevenar franchise and Enbrel;
•the inclusion of operational revenues from legacy King products of approximately $950 million, which favorably impacted biopharmaceutical
revenues by 2%; and
•the favorable impact of foreign exchange of $1.7 billion, or 3%.
18 2011 Financial Report