Pfizer 2011 Annual Report Download - page 4
Download and view the complete annual report
Please find page 4 of the 2011 Pfizer annual report below. You can navigate through the pages in the report by either clicking on the pages listed below, or by using the keyword search tool below to find specific information within the annual report.-
 1
1 -
 2
2 -
 3
3 -
 4
4 -
 5
5 -
 6
6 -
 7
7 -
 8
8 -
 9
9 -
 10
10 -
 11
11 -
 12
12 -
 13
13 -
 14
14 -
 15
15 -
16
-
17
-
18
-
19
-
20
-
21
-
22
-
23
-
24
-
25
-
26
-
27
-
28
-
29
-
30
-
31
-
32
-
33
-
34
-
35
-
36
-
37
-
38
-
39
-
40
-
41
-
42
-
43
-
44
-
45
-
46
-
47
-
48
-
49
-
50
-
51
-
52
-
53
-
54
-
55
-
56
-
57
-
58
-
59
-
60
-
61
-
62
-
63
-
64
-
65
-
66
-
67
-
68
-
69
-
70
-
71
-
72
-
73
-
74
-
75
-
76
-
77
-
78
-
79
-
80
-
81
-
82
-
83
-
84
-
85
-
86
-
87
-
88
-
89
-
90
-
91
-
92
-
93
-
94
-
95
-
96
-
97
-
98
-
99
-
100
-
101
-
102
-
103
-
104
-
105
-
106
-
107
-
108
-
109
-
110
-
111
-
112
-
113
-
114
-
115
-
116
-
117
 |
 |

Financial Review
Pfizer Inc. and Subsidiary Companies
Our 2011 Performance
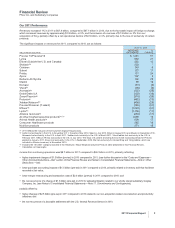
Revenues increased 1% in 2011 to $67.4 billion, compared to $67.1 billion in 2010, due to the favorable impact of foreign exchange,
which increased revenues by approximately $1.9 billion, or 3%, and the inclusion of revenues of $1.3 billion or 2% from our
acquisition of King, partially offset by a net operational decline of $2.9 billion, or 4%, primarily due to the loss of exclusivity of certain
products.
The significant impacts on revenues for 2011, compared to 2010, are as follows:
2011 vs. 2010
(MILLIONS OF DOLLARS)
INCREASE/
(DECREASE)
%
CHANGE
Prevnar 13/Prevenar13 $ 1,241 51
Lyrica 630 21
Enbrel (Outside the U.S. and Canada) 392 12
Skelaxin(a) 203 *
Celebrex 149 6
Sutent 121 11
Pristiq 111 24
Zyvox 107 9
ReFacto AF/Xyntha 102 25
Medrol 55 12
Norvasc (61) (4)
Vfend(b) (78) (9)
Aromasin(b) (122) (25)
Detrol/Detrol LA (130) (13)
Zosyn/Tazocin(b) (316) (33)
Protonix(b) (482) (70)
Xalatan/Xalacom(b) (499) (29)
Prevnar/Prevenar (7-valent) (765) (61)
Effexor(b) (1,040) (61)
Lipitor(b) (1,156) (11)
Alliance revenues(b) (454) (11)
All other biopharmaceutical products(a), (c) 1,056 19
Animal Health products(a) 609 17
Consumer Healthcare products 285 10
Nutrition products 271 15
(a) 2011 reflects the inclusion of revenues from legacy King products.
(b) Lipitor lost exclusivity in the U.S. in November 2011, Canada in May 2010, Spain in July 2010, Brazil in August 2010 and Mexico in December 2010.
Aromasin lost exclusivity in the U.S. in April 2011. Xalatan lost exclusivity in the U.S. in March 2011. Vfend tablets lost exclusivity in the U.S. in
February 2011. Effexor XR lost exclusivity in the U.S. in July 2010. The basic U.S. patent (including the six-month exclusivity period) for Protonix
expired in January 2011. Zosyn lost exclusivity in the U.S. in September 2009. We lost exclusivity for Aricept 5mg and 10mg tablets, which are
included in Alliance revenues, in November 2010.
(c) Includes the “All other” category included in the Revenues—Major Biopharmaceutical Products table presented in this Financial Review.
* Calculation not meaningful.
Income from continuing operations was $8.7 billion in 2011 compared to $8.2 billion in 2010, primarily reflecting:
•higher impairment charges of $1.3 billion (pre-tax) in 2010 compared to 2011, (see further discussion in the “Costs and Expenses––
Other (Income)/Deductions––Net” section of this Financial Review and Notes to Consolidated Financial Statements—Note 4. Other
Deductions––net);
•lower purchase accounting impacts of $1.5 billion (pre-tax) in 2011 compared to 2010, primarily related to inventory sold that had been
recorded at fair value;
•lower merger restructuring and transaction costs of $2.0 billion (pre-tax) in 2011 compared to 2010; and
•the non-recurrence of a charge of $1.3 billion (pre-tax) in 2010 for asbestos litigation related to our wholly owned subsidiary Quigley
Company, Inc. (see Notes to Consolidated Financial Statements––Note 17. Commitments and Contingencies),
partially offset by:
•higher charges of $2.5 billion (pre-tax) in 2011 compared to 2010 related to our non-acquisition related cost-reduction and productivity
initiatives; and
•the non-recurrence of a favorable settlement with the U.S. Internal Revenue Service in 2010.
2011 Financial Report 3