Pfizer 2011 Annual Report Download - page 44
Download and view the complete annual report
Please find page 44 of the 2011 Pfizer annual report below. You can navigate through the pages in the report by either clicking on the pages listed below, or by using the keyword search tool below to find specific information within the annual report.-
 1
1 -
2
-
3
-
4
-
5
-
6
-
7
-
8
-
9
-
10
-
11
-
12
-
13
-
14
-
15
-
16
-
17
-
18
-
19
-
20
-
21
-
22
-
23
-
24
-
25
-
26
-
27
-
28
-
29
-
30
-
31
-
32
-
33
-
 34
34 -
 35
35 -
 36
36 -
 37
37 -
 38
38 -
 39
39 -
 40
40 -
 41
41 -
 42
42 -
 43
43 -
 44
44 -
 45
45 -
 46
46 -
 47
47 -
 48
48 -
 49
49 -
 50
50 -
 51
51 -
 52
52 -
 53
53 -
 54
54 -
55
-
56
-
57
-
58
-
59
-
60
-
61
-
62
-
63
-
64
-
65
-
66
-
67
-
68
-
69
-
70
-
71
-
72
-
73
-
74
-
75
-
76
-
77
-
78
-
79
-
80
-
81
-
82
-
83
-
84
-
85
-
86
-
87
-
88
-
89
-
90
-
91
-
92
-
93
-
94
-
95
-
96
-
97
-
98
-
99
-
100
-
101
-
102
-
103
-
104
-
105
-
106
-
107
-
108
-
109
-
110
-
111
-
112
-
113
-
114
-
115
-
116
-
117
 |
 |

Financial Review
Pfizer Inc. and Subsidiary Companies
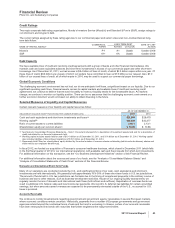
Credit Ratings
Two major corporate debt-rating organizations, Moody’s Investors Service (Moody’s) and Standard & Poor’s (S&P), assign ratings to
our short-term and long-term debt.
The current ratings assigned by these rating agencies to our commercial paper and senior unsecured non-credit-enhanced long-
term debt follow:
NAME OF RATING AGENCY
COMMERCIAL
PAPER
LONG-TERM DEBT DATE OF LAST
ACTIONRATING OUTLOOK
Moody’s P-1 A1 Stable October 2009
S&P A1+ AA Stable October 2009
Debt Capacity
We have available lines of credit and revolving credit agreements with a group of banks and other financial intermediaries. We
maintain cash and cash equivalent balances and short-term investments in excess of our commercial paper and other short-term
borrowings. As of December 31, 2011, we had access to $9.4 billion of lines of credit, of which $2.3 billion expire within one year. Of
these lines of credit, $8.6 billion are unused, of which our lenders have committed to loan us $7.5 billion at our request. Also, $7.0
billion of our unused lines of credit, all of which expire in 2016, may be used to support our commercial paper borrowings.
Global Economic Conditions
The challenging economic environment has not had, nor do we anticipate it will have, a significant impact on our liquidity. Due to our
significant operating cash flows, financial assets, access to capital markets and available lines of credit and revolving credit
agreements, we continue to believe that we have the ability to meet our liquidity needs for the foreseeable future. As markets
change, we continue to monitor our liquidity position. There can be no assurance that the challenging economic environment or a
further economic downturn would not impact our ability to obtain financing in the future.
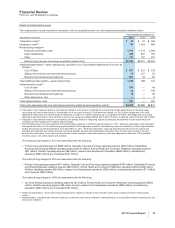
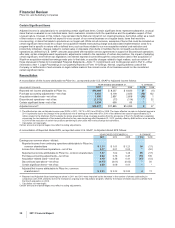
Selected Measures of Liquidity and Capital Resources
Certain relevant measures of our liquidity and capital resources follow:
AS OF DECEMBER 31,
(MILLIONS OF DOLLARS, EXCEPT RATIOS AND PER COMMON SHARE DATA) 2011 2010
Cash and cash equivalents and short-term investments and loans(a) $26,809 $28,479
Working capital(b) $29,659 $32,377
Ratio of current assets to current liabilities 2.06:1 2.13:1
Shareholders’ equity per common share(c) $ 10.85 $ 10.96
(a) See Notes to Consolidated Financial Statements – Note 7. Financial Instruments for a description of investment assets held and for a description of
credit risk related to our financial instruments held.
(b) Working capital includes assets held for sale of $101 million as of December 31, 2011, and $1.4 billion as of December 31, 2010. Working capital
also includes liabilities of discontinued operations of $151 million as of December 31, 2010.
(c) Represents total Pfizer Inc. shareholders’ equity divided by the actual number of common shares outstanding (which excludes treasury shares and
share held by our employee benefit trust).
In fiscal 2012, we funded our acquisition of Ferrosan’s consumer healthcare business, which closed in December 2011 (which falls
in the first fiscal quarter of 2012 for our international operations), with available cash and the proceeds from short-term investments.
For additional information on this transaction, see the “Our Business Development Initiatives” section of this Financial Review.
For additional information about the sources and uses of our funds, see the “Analysis of Consolidated Balance Sheets” and
“Analysis of Consolidated Statements of Cash Flows” sections of this Financial Review.
Domestic and International Short-Term Funds
Many of our operations are conducted outside the U.S., and significant portions of our cash, cash equivalents and short-term
investments are held internationally. We generally hold approximately 10%-30% of these short-term funds in U.S. tax jurisdictions.
The amount of funds held in U.S. tax jurisdictions can fluctuate due to the timing of receipts and payments in the ordinary course of
business and due to other reasons, such as business-development activities. As part of our ongoing liquidity assessments, we
regularly monitor the mix of domestic and international cash flows (both inflows and outflows). Repatriation of overseas funds can
result in additional U.S. federal, state and local income tax payments. We record U.S. deferred tax liabilities for certain unremitted
earnings, but when amounts earned overseas are expected to be permanently reinvested outside of the U.S., no accrual for U.S.
taxes is provided.
Accounts Receivable
We continue to monitor developments regarding government and government agency receivables in several European markets,
where economic conditions remain uncertain. Historically, payments from a number of European governments and government
agencies extend beyond the contractual terms of sale and the trend is worsening. In Greece, certain of our accounts receivable
have been restructured into bonds with maturities that further lengthened the repayment timeline.
2011 Financial Report 43