Pfizer 2011 Annual Report Download - page 42
Download and view the complete annual report
Please find page 42 of the 2011 Pfizer annual report below. You can navigate through the pages in the report by either clicking on the pages listed below, or by using the keyword search tool below to find specific information within the annual report.-
 1
1 -
2
-
3
-
4
-
5
-
6
-
7
-
8
-
9
-
10
-
11
-
12
-
13
-
14
-
15
-
16
-
17
-
18
-
19
-
20
-
21
-
22
-
23
-
24
-
25
-
26
-
27
-
28
-
29
-
30
-
31
-
 32
32 -
 33
33 -
 34
34 -
 35
35 -
 36
36 -
 37
37 -
 38
38 -
 39
39 -
 40
40 -
 41
41 -
 42
42 -
 43
43 -
 44
44 -
 45
45 -
 46
46 -
 47
47 -
 48
48 -
 49
49 -
 50
50 -
 51
51 -
 52
52 -
53
-
54
-
55
-
56
-
57
-
58
-
59
-
60
-
61
-
62
-
63
-
64
-
65
-
66
-
67
-
68
-
69
-
70
-
71
-
72
-
73
-
74
-
75
-
76
-
77
-
78
-
79
-
80
-
81
-
82
-
83
-
84
-
85
-
86
-
87
-
88
-
89
-
90
-
91
-
92
-
93
-
94
-
95
-
96
-
97
-
98
-
99
-
100
-
101
-
102
-
103
-
104
-
105
-
106
-
107
-
108
-
109
-
110
-
111
-
112
-
113
-
114
-
115
-
116
-
117
 |
 |

Financial Review
Pfizer Inc. and Subsidiary Companies
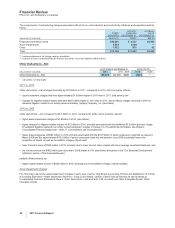
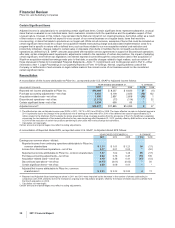
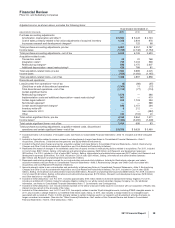
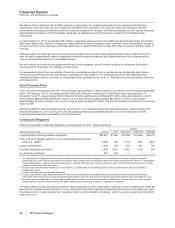
ANALYSIS OF THE CONSOLIDATED STATEMENTS OF CASH FLOWS
YEAR ENDED DECEMBER 31, % INCR./(DECR.)
(MILLIONS OF DOLLARS) 2011 2010 2009 11/10 10/09
Cash provided by/(used in):
Operating activities $ 20,240 $ 11,454 $ 16,587 77 (31)
Investing activities 2,200 (492) (31,272) *(98)
Financing activities (20,607) (11,174) 14,481 (84) *
Effect of exchange-rate changes on cash and cash
equivalents (29) (31) 60 6*
Net increase/decrease in cash and cash equivalents $ 1,804 $ (243) $ (144) *(69)
* Calculation not meaningful
Operating Activities
2011 vs. 2010
Our net cash provided by operating activities was $20.2 billion in 2011, compared to $11.5 billion in 2010. The increase in operating
cash flows was primarily attributable to:
•income tax payments made in 2010 of approximately $11.8 billion, primarily associated with certain business decisions executed to
finance the Wyeth acquisition, including the decision to repatriate certain funds earned outside the U.S., compared with $2.9 billion in
2011; and
•the timing of receipts and payments in the ordinary course of business.
In 2010, the cash flow line item called Other tax accounts, net, reflects the $11.8 billion tax payment described above.
2010 vs. 2009
Our net cash provided by continuing operating activities was $11.5 billion in 2010, compared to $16.6 billion in 2009. The decrease
in net cash provided by operating activities was primarily attributable to:
•income tax payments in 2010 of approximately $11.8 billion, primarily associated with certain business decisions executed to finance
the Wyeth acquisition, including the decision to repatriate certain funds earned outside the U.S., compared with $2.3 billion in 2009;
partially offset by:
•the inclusion of operating cash flows from legacy Wyeth operations for a full year in 2010;
•the non-recurrence of payments in 2009 in connection with the resolution of certain legal matters related to Bextra and certain other
products and our NSAID pain medicines of approximately $3.2 billion; and
•the timing of receipts and payments in the ordinary course of business.
Investing Activities
2011 vs. 2010
Our net cash provided by investing activities was $2.2 billion in 2011, compared to $492 million net cash used in 2010. The increase
in cash provided by investing activities was primarily attributable to:
•net proceeds from redemptions, purchases and sales of investments of $4.1 billion in 2011, which were primarily used to finance our
acquisitions, compared to net proceeds from redemptions, purchases and sales of investments of $23 million in 2010; and
•net proceeds of $2.4 billion received from the sale of Capsugel in 2011 (see Notes to Consolidated Financial Statements—Note 2D.
Acquisitions, Divestitures, Collaborative Arrangements and Equity-Method Investments: Divestitures);
partially offset by:
•net cash of $3.3 billion paid for the acquisitions of King, Excaliard and Icagen in 2011, compared to $273 million paid for the
acquisitions of FoldRx, Vetnex and Synbiotics in 2010.
2010 vs. 2009
Our net cash used in investing activities was $492 million in 2010, compared to $31.3 billion in 2009. The decrease in net cash used
in investing activities was primarily attributable to:
•net cash paid for acquisitions of $273 million in 2010 compared to $43.1 billion in 2009 for the acquisition of Wyeth;
partially offset by:
•net proceeds from redemptions and sales of investments of $23 million in 2010, compared to net proceeds from redemptions and sales
of investments of $12.4 billion in 2009.
2011 Financial Report 41