Pfizer 2011 Annual Report Download - page 111
Download and view the complete annual report
Please find page 111 of the 2011 Pfizer annual report below. You can navigate through the pages in the report by either clicking on the pages listed below, or by using the keyword search tool below to find specific information within the annual report.-
 1
1 -
2
-
3
-
4
-
5
-
6
-
7
-
8
-
9
-
10
-
11
-
12
-
13
-
14
-
15
-
16
-
17
-
18
-
19
-
20
-
21
-
22
-
23
-
24
-
25
-
26
-
27
-
28
-
29
-
30
-
31
-
32
-
33
-
34
-
35
-
36
-
37
-
38
-
39
-
40
-
41
-
42
-
43
-
44
-
45
-
46
-
47
-
48
-
49
-
50
-
51
-
52
-
53
-
54
-
55
-
56
-
57
-
58
-
59
-
60
-
61
-
62
-
63
-
64
-
65
-
66
-
67
-
68
-
69
-
70
-
71
-
72
-
73
-
74
-
75
-
76
-
77
-
78
-
79
-
80
-
81
-
82
-
83
-
84
-
85
-
86
-
87
-
88
-
89
-
90
-
91
-
92
-
93
-
94
-
95
-
96
-
97
-
98
-
99
-
100
-
 101
101 -
 102
102 -
 103
103 -
 104
104 -
 105
105 -
 106
106 -
 107
107 -
 108
108 -
 109
109 -
 110
110 -
 111
111 -
 112
112 -
 113
113 -
 114
114 -
 115
115 -
 116
116 -
 117
117
 |
 |

Notes to Consolidated Financial Statements
Pfizer Inc. and Subsidiary Companies
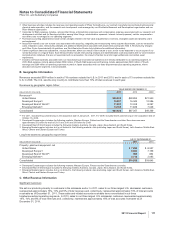
Segment Assets
We manage our assets on a total company basis, not by operating segment, as many of our operating assets are shared (such as
our plant network assets) or commingled (such as accounts receivable, as many of our customers are served by multiple operating
segments). Therefore, our chief operating decision maker does not regularly review any asset information by operating segment
and, accordingly, we do not report asset information by operating segment. Total assets were approximately $188 billion at
December 31, 2011 and approximately $195 billion at December 31, 2010.
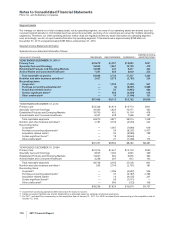
Selected Income Statement Information
Selected income statement information follows:
(MILLIONS OF DOLLARS) REVENUES R&D EXPENSES EARNINGS(a)
DEPRECIATION &
AMORTIZATION(b)
YEAR ENDED DECEMBER 31, 2011(c)
Primary Care $22,670 $1,307 $15,001 $247
Specialty Care and Oncology 16,568 1,561 10,789 419
Established Products and Emerging Markets 18,509 441 9,417 422
Animal Health and Consumer Healthcare 7,241 425 2,020 232
Total reportable segments 64,988 3,734 37,227 1,320
Nutrition and other business activities(d) 2,437 3,378 (2,793) 230
Reconciling Items:
Corporate(e) — 1,309 (7,430) 541
Purchase accounting adjustments(f) — (2) (6,801) 5,565
Acquisition-related costs(g) — 23 (1,983) 624
Certain significant items(h) — 656 (4,354) 615
Other unallocated(i) — 14 (1,104) 131
$67,425 $9,112 $12,762 $9,026
YEAR ENDED DECEMBER 31, 2010
Primary Care $23,328 $1,473 $15,773 $201
Specialty Care and Oncology 16,435 1,624 10,571 432
Established Products and Emerging Markets 18,760 452 10,100 418
Animal Health and Consumer Healthcare 6,347 428 1,569 197
Total reportable segments 64,870 3,977 38,013 1,248
Nutrition and other business activities(d) 2,187 3,743 (3,263) 242
Reconciling Items:
Corporate(e) — 1,567 (7,990) 619
Purchase accounting adjustments(f) — 26 (8,257) 5,477
Acquisition-related costs(g) — 34 (3,989) 788
Certain significant items(h) — 18 (3,964) —
Other unallocated(i) — 27 (1,268) 113
$67,057 $9,392 $9,282 $8,487
YEAR ENDED DECEMBER 31, 2009(c)
Primary Care $22,576 $1,407 $15,100 $130
Specialty Care and Oncology 8,925 1,060 4,661 269
Established Products and Emerging Markets 13,947 392 6,955 360
Animal Health and Consumer Healthcare 3,258 297 812 142
Total reportable segments 48,706 3,156 27,528 901
Nutrition and other business activities(d) 563 2,706 (2,751) 181
Reconciling Items:
Corporate(e) — 1,296 (4,657) 526
Purchase accounting adjustments(f) — 37 (3,787) 2,799
Acquisition-related costs(g) — 13 (4,025) 241
Certain significant items(h) — 56 (1,511) —
Other unallocated(i) — 560 (123) 109
$49,269 $7,824 $10,674 $4,757
(a) Income from continuing operations before provision for taxes on income.
(b) Certain production facilities are shared. Depreciation is allocated based on estimates of physical production.
(c) For 2011, includes King commencing on the acquisition date of January 31, 2011. For 2009, includes Wyeth commencing on the acquisition date of
October 15, 2009.
110 2011 Financial Report