Pfizer 2011 Annual Report Download - page 43
Download and view the complete annual report
Please find page 43 of the 2011 Pfizer annual report below. You can navigate through the pages in the report by either clicking on the pages listed below, or by using the keyword search tool below to find specific information within the annual report.-
 1
1 -
2
-
3
-
4
-
5
-
6
-
7
-
8
-
9
-
10
-
11
-
12
-
13
-
14
-
15
-
16
-
17
-
18
-
19
-
20
-
21
-
22
-
23
-
24
-
25
-
26
-
27
-
28
-
29
-
30
-
31
-
32
-
 33
33 -
 34
34 -
 35
35 -
 36
36 -
 37
37 -
 38
38 -
 39
39 -
 40
40 -
 41
41 -
 42
42 -
 43
43 -
 44
44 -
 45
45 -
 46
46 -
 47
47 -
 48
48 -
 49
49 -
 50
50 -
 51
51 -
 52
52 -
 53
53 -
54
-
55
-
56
-
57
-
58
-
59
-
60
-
61
-
62
-
63
-
64
-
65
-
66
-
67
-
68
-
69
-
70
-
71
-
72
-
73
-
74
-
75
-
76
-
77
-
78
-
79
-
80
-
81
-
82
-
83
-
84
-
85
-
86
-
87
-
88
-
89
-
90
-
91
-
92
-
93
-
94
-
95
-
96
-
97
-
98
-
99
-
100
-
101
-
102
-
103
-
104
-
105
-
106
-
107
-
108
-
109
-
110
-
111
-
112
-
113
-
114
-
115
-
116
-
117
 |
 |

Financial Review
Pfizer Inc. and Subsidiary Companies
Financing Activities
2011 vs. 2010
Our net cash used in financing activities was $20.6 billion in 2011, compared to $11.2 billion in 2010. The increase in net cash used
in financing activities was primarily attributable to:
•net repayments of borrowings of $5.5 billion in 2011, compared to net repayments of borrowings of $4.2 billion in 2010; and
•purchases of our common stock of $9.0 billion in 2011, compared to purchases of $1.0 billion in 2010.
2010 vs. 2009
Our net cash used in financing activities was $11.2 billion in 2010 compared to net cash provided by financing activities of $14.5
billion in 2009. The change in financing cash flows was primarily attributable to:
•net repayments of borrowings of $4.2 billion in 2010, compared to net proceeds from borrowings of $20.1 billion in 2009, primarily
associated with our acquisition of Wyeth; and
•purchases of our common stock of $1.0 billion in 2010, compared to no purchases in 2009.
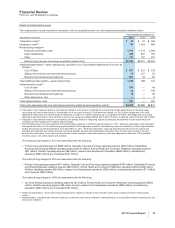
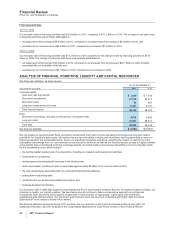
ANALYSIS OF FINANCIAL CONDITION, LIQUIDITY AND CAPITAL RESOURCES
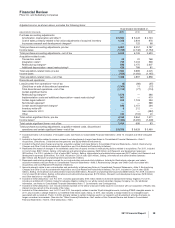
Net Financial Liabilities, as shown below:
AS OF DECEMBER 31,
(MILLIONS OF DOLLARS) 2011 2010
Financial assets:
Cash and cash equivalents $ 3,539 $ 1,735
Short-term investments 23,219 26,277
Short-term loans 51 467
Long-term investments and loans 9,457 9,747
Total financial assets 36,266 38,226
Debt:
Short-term borrowings, including current portion of long-term debt 4,018 5,603
Long-term debt 34,931 38,410
Total debt 38,949 44,013
Net financial liabilities $ (2,683) $ (5,787)
We rely largely on operating cash flows, short-term investments, short-term commercial paper borrowings and long-term debt to
provide for our liquidity requirements. We believe that we have the ability to obtain both short-term and long-term debt to meet our
financing needs for the foreseeable future. Due to our significant operating cash flows, including the impact on cash flows of the
anticipated cost savings from our cost-reduction and productivity initiatives, as well as our financial assets, access to capital markets
and available lines of credit and revolving credit agreements, we further believe that we have the ability to meet our liquidity needs
for the foreseeable future, which include:
•the working capital requirements of our operations, including our research and development activities;
•investments in our business;
•dividend payments and potential increases in the dividend rate;
•share repurchases, including our plan to repurchase approximately $5 billion of our common stock in 2012;
•the cash requirements associated with our cost-reduction/productivity initiatives;
•paying down outstanding debt;
•contributions to our pension and postretirement plans; and
•business-development activities.
Our long-term debt is rated high quality by both Standard & Poor’s and Moody’s Investors Service. As market conditions change, we
continue to monitor our liquidity position. We have taken and will continue to take a conservative approach to our financial
investments. Both short-term and long-term investments consist primarily of high-quality, highly liquid, well-diversified,
available-for-sale debt securities. Our short-term and long-term loans are due from companies with highly rated securities
(Standard & Poor’s ratings of mostly AA or better).
Net financial liabilities decreased during 2011 primarily due to a reduction in short-term borrowings and long-term debt. For
additional information, see the “Analysis of the Consolidated Statements of Cash Flows” section of this Financial Review.
42 2011 Financial Report