Pfizer 2011 Annual Report Download - page 16
Download and view the complete annual report
Please find page 16 of the 2011 Pfizer annual report below. You can navigate through the pages in the report by either clicking on the pages listed below, or by using the keyword search tool below to find specific information within the annual report.-
 1
1 -
2
-
3
-
4
-
5
-
 6
6 -
 7
7 -
 8
8 -
 9
9 -
 10
10 -
 11
11 -
 12
12 -
 13
13 -
 14
14 -
 15
15 -
 16
16 -
 17
17 -
 18
18 -
 19
19 -
 20
20 -
 21
21 -
 22
22 -
 23
23 -
 24
24 -
 25
25 -
 26
26 -
27
-
28
-
29
-
30
-
31
-
32
-
33
-
34
-
35
-
36
-
37
-
38
-
39
-
40
-
41
-
42
-
43
-
44
-
45
-
46
-
47
-
48
-
49
-
50
-
51
-
52
-
53
-
54
-
55
-
56
-
57
-
58
-
59
-
60
-
61
-
62
-
63
-
64
-
65
-
66
-
67
-
68
-
69
-
70
-
71
-
72
-
73
-
74
-
75
-
76
-
77
-
78
-
79
-
80
-
81
-
82
-
83
-
84
-
85
-
86
-
87
-
88
-
89
-
90
-
91
-
92
-
93
-
94
-
95
-
96
-
97
-
98
-
99
-
100
-
101
-
102
-
103
-
104
-
105
-
106
-
107
-
108
-
109
-
110
-
111
-
112
-
113
-
114
-
115
-
116
-
117
 |
 |

Financial Review
Pfizer Inc. and Subsidiary Companies
turnover, retirement age and mortality (life expectancy); expected return on assets; and healthcare cost trend rates. Our
assumptions reflect our historical experiences and our best judgment regarding future expectations that have been deemed
reasonable by management. The judgments made in determining the costs of our benefit plans can materially impact our results of
operations.
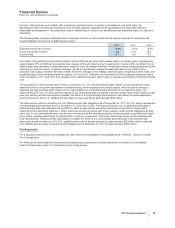
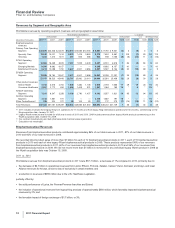
The following table shows the expected versus actual rate of return on plan assets and the discount rate used to determine the
benefit obligations for the U.S. qualified pension plans:
2011 2010 2009
Expected annual rate of return 8.5% 8.5% 8.5%
Actual annual rate of return 3.8 10.8 14.2
Discount rate 5.1 5.9 6.3
As a result of the global financial market downturn during 2008, the fair value of the assets held in our pension plans decreased by
approximately 21% in 2008 and we estimate those losses will be amortized over a 10-year period. In early 2009, we shifted from an
explicit target asset allocation to asset allocation ranges in order to maintain flexibility in meeting minimum funding requirements and
achieving our expected return on assets. However, we did not significantly change the asset allocation during 2009 and the
allocation was largely consistent with that of 2008. No further changes to the strategic asset allocation ranges have been made, and
actual allocations have remained stable throughout 2010 and 2011. Therefore, we maintained the 8.5% expected long-term rate of
return on assets in 2011 and 2010. Any changes in the expected long-term rate of return on assets would impact net periodic benefit
cost.
The assumption for the expected rate of return on assets for our U.S. and international plans reflects our actual historical return
experience and our long-term assessment of forward-looking return expectations by asset classes, which is used to develop a
weighted-average expected return based on the implementation of our targeted asset allocation in our respective plans. The
expected return for our U.S. plans and the majority of our international plans is applied to the fair market value of plan assets at each
year end. Holding all other assumptions constant, the effect of a 0.5 percentage-point decline in the return-on-assets assumption
would increase our 2012 U.S. qualified pension plans’ pre-tax expense by approximately $59 million.
The discount rate used in calculating our U.S. defined benefit plan obligations as of December 31, 2011, is 5.1%, which represents a
0.8 percentage-point decrease from our December 31, 2010 rate of 5.9%. The discount rate for our U.S. defined benefit plans is
determined annually and evaluated and modified to reflect at year-end the prevailing market rate of a portfolio of high-quality
corporate bond investments rated AA or better that would provide the future cash flows needed to settle benefit obligations as they
come due. For our international plans, the discount rates are set by benchmarking against investment grade corporate bonds rated
AA or better, including where there is sufficient data, a yield curve approach. These rate determinations are made consistent with
local requirements. Holding all other assumptions constant, the effect of a 0.1 percentage-point decrease in the discount rate
assumption would increase our 2012 U.S. qualified pension plans’ pre-tax expense by approximately $29 million and increase the
U.S. qualified pension plans’ projected benefit obligations as of December 31, 2011 by approximately $233 million.
Contingencies
For a discussion about income tax contingencies, see Notes to Consolidated Financial Statements—Note 5D. Taxes on Income:
Tax Contingencies.
For a discussion about legal and environmental contingencies, guarantees and indemnifications, see Notes to Consolidated
Financial Statements—Note 17. Commitments and Contingencies.
2011 Financial Report 15