Pep Boys 2008 Annual Report Download - page 92
Download and view the complete annual report
Please find page 92 of the 2008 Pep Boys annual report below. You can navigate through the pages in the report by either clicking on the pages listed below, or by using the keyword search tool below to find specific information within the annual report.-
 1
1 -
2
-
3
-
4
-
5
-
6
-
7
-
8
-
9
-
10
-
11
-
12
-
13
-
14
-
15
-
16
-
17
-
18
-
19
-
20
-
21
-
22
-
23
-
24
-
25
-
26
-
27
-
28
-
29
-
30
-
31
-
32
-
33
-
34
-
35
-
36
-
37
-
38
-
39
-
40
-
41
-
42
-
43
-
44
-
45
-
46
-
47
-
48
-
49
-
50
-
51
-
52
-
53
-
54
-
55
-
56
-
57
-
58
-
59
-
60
-
61
-
62
-
63
-
64
-
65
-
66
-
67
-
68
-
69
-
70
-
71
-
72
-
73
-
74
-
75
-
76
-
77
-
78
-
79
-
80
-
81
-
 82
82 -
 83
83 -
 84
84 -
 85
85 -
 86
86 -
 87
87 -
 88
88 -
 89
89 -
 90
90 -
 91
91 -
 92
92 -
 93
93 -
 94
94 -
 95
95 -
 96
96 -
 97
97 -
 98
98 -
 99
99 -
 100
100 -
 101
101 -
 102
102 -
103
-
104
-
105
-
106
-
107
-
108
-
109
-
110
-
111
-
112
-
113
-
114
-
115
-
116
-
117
-
118
-
119
-
120
-
121
-
122
-
123
-
124
-
125
-
126
-
127
-
128
-
129
-
130
-
131
-
132
-
133
-
134
-
135
-
136
-
137
-
138
-
139
-
140
-
141
-
142
-
143
-
144
-
145
-
146
-
147
-
148
-
149
-
150
-
151
-
152
-
153
-
154
-
155
-
156
-
157
-
158
-
159
-
160
-
161
-
162
-
163
-
164
-
165
-
166
-
167
-
168
 |
 |

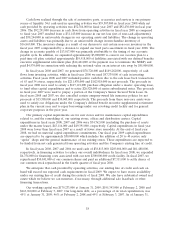
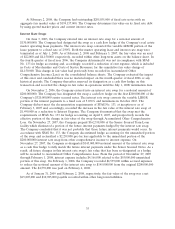
Non-operating income as a percentage of total revenues decreased from 0.3% in fiscal 2006 to
0.2% in fiscal 2007. This decrease in dollars of $1,777,000 was due to the shorter investment period of
available funds in fiscal 2007 as compared to fiscal 2006.
Discontinued operations was a loss, net of tax, of $3,601,000 in fiscal 2007 versus income, net of
tax, of $4,333,000, in fiscal 2006. Fiscal 2007’s loss resulted primarily from the impairment charges and
closure costs associated with the 11 stores closed in the fourth quarter that were reclassified to
discontinued operations. Fiscal 2006’s results for such locations include a gain, net of tax, of $4,468,000
on the sale of one location.
Our income tax benefit as a percentage of loss from continuing operations before income taxes
and cumulative effect of change in accounting principle was 40.6% or $25,594,000 versus 47.5% or
$6,399,000. The decrease in the effective tax rate is primarily due to a non cash adjustment of
$2,451,000 to our state deferred liabilities resulting from a change in our filing position in 2006, offset
by an additional tax benefit of $4,227,000 recorded in fiscal year 2007 relating to uncertain tax positions
for tax years closed due to the statute of limitations and lower effective state tax rates.
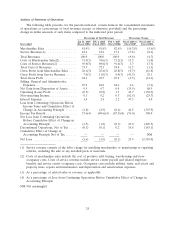
Industry Comparison
We operate in the U.S. automotive aftermarket, which has two general lines of business: the
Do-It-For-Me (‘‘DIFM’’) (service labor, installed merchandise and tires) market and the Do-It-Yourself
(‘‘DIY’’) (retail merchandise) market. Generally, the specialized automotive retailers focus on either
the ‘‘DIY’’ or ‘‘DIFM’’ areas of the business. We believe that operation in both the ‘‘DIY’’ and
‘‘DIFM’’ areas of the business positively differentiates us from most of our competitors. Although we
manage our store performance at a store level in aggregation, we believe that the following
presentation shows an accurate comparison against competitors within the two sales arenas. We
compete in the ‘‘DIY’’ area of the business through our retail sales floor and commercial sales business
(Retail Sales). Our Service Center business (labor and installed merchandise and tires) competes in the
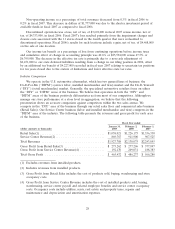
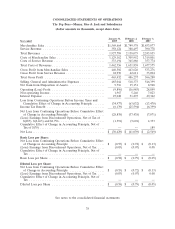
‘‘DIFM’’ area of the industry. The following table presents the revenues and gross profit for each area
of the business.
Fiscal Year ended
January 31, February 2, February 3,
(dollar amounts in thousands) 2009 2008 2007
Retail Sales(1) ..................................... $1,058,021 $1,226,175 $1,336,330
Service Center Revenue(2) ............................ 869,767 911,900 907,525
Total Revenues .................................... $1,927,788 $2,138,075 $2,243,855
Gross Profit from Retail Sales(3) ....................... $ 273,262 $ 277,206 $ 377,897
Gross Profit from Service Center Revenue(4) .............. 192,170 209,031 188,383
Total Gross Profit .................................. $ 465,432 $ 486,237 $ 566,280
(1) Excludes revenues from installed products.
(2) Includes revenues from installed products.
(3) Gross Profit from Retail Sales includes the cost of products sold, buying, warehousing and store
occupancy costs.
(4) Gross Profit from Service Center Revenue includes the cost of installed products sold, buying,
warehousing, service center payroll and related employee benefits and service center occupancy
costs. Occupancy costs include utilities, rents, real estate and property taxes, repairs and
maintenance and depreciation and amortization expenses.
28