Pep Boys 2008 Annual Report Download - page 79
Download and view the complete annual report
Please find page 79 of the 2008 Pep Boys annual report below. You can navigate through the pages in the report by either clicking on the pages listed below, or by using the keyword search tool below to find specific information within the annual report.-
 1
1 -
2
-
3
-
4
-
5
-
6
-
7
-
8
-
9
-
10
-
11
-
12
-
13
-
14
-
15
-
16
-
17
-
18
-
19
-
20
-
21
-
22
-
23
-
24
-
25
-
26
-
27
-
28
-
29
-
30
-
31
-
32
-
33
-
34
-
35
-
36
-
37
-
38
-
39
-
40
-
41
-
42
-
43
-
44
-
45
-
46
-
47
-
48
-
49
-
50
-
51
-
52
-
53
-
54
-
55
-
56
-
57
-
58
-
59
-
60
-
61
-
62
-
63
-
64
-
65
-
66
-
67
-
68
-
 69
69 -
 70
70 -
 71
71 -
 72
72 -
 73
73 -
 74
74 -
 75
75 -
 76
76 -
 77
77 -
 78
78 -
 79
79 -
 80
80 -
 81
81 -
 82
82 -
 83
83 -
 84
84 -
 85
85 -
 86
86 -
 87
87 -
 88
88 -
 89
89 -
90
-
91
-
92
-
93
-
94
-
95
-
96
-
97
-
98
-
99
-
100
-
101
-
102
-
103
-
104
-
105
-
106
-
107
-
108
-
109
-
110
-
111
-
112
-
113
-
114
-
115
-
116
-
117
-
118
-
119
-
120
-
121
-
122
-
123
-
124
-
125
-
126
-
127
-
128
-
129
-
130
-
131
-
132
-
133
-
134
-
135
-
136
-
137
-
138
-
139
-
140
-
141
-
142
-
143
-
144
-
145
-
146
-
147
-
148
-
149
-
150
-
151
-
152
-
153
-
154
-
155
-
156
-
157
-
158
-
159
-
160
-
161
-
162
-
163
-
164
-
165
-
166
-
167
-
168
 |
 |
6APR200921180875
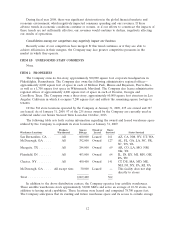
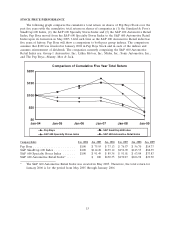
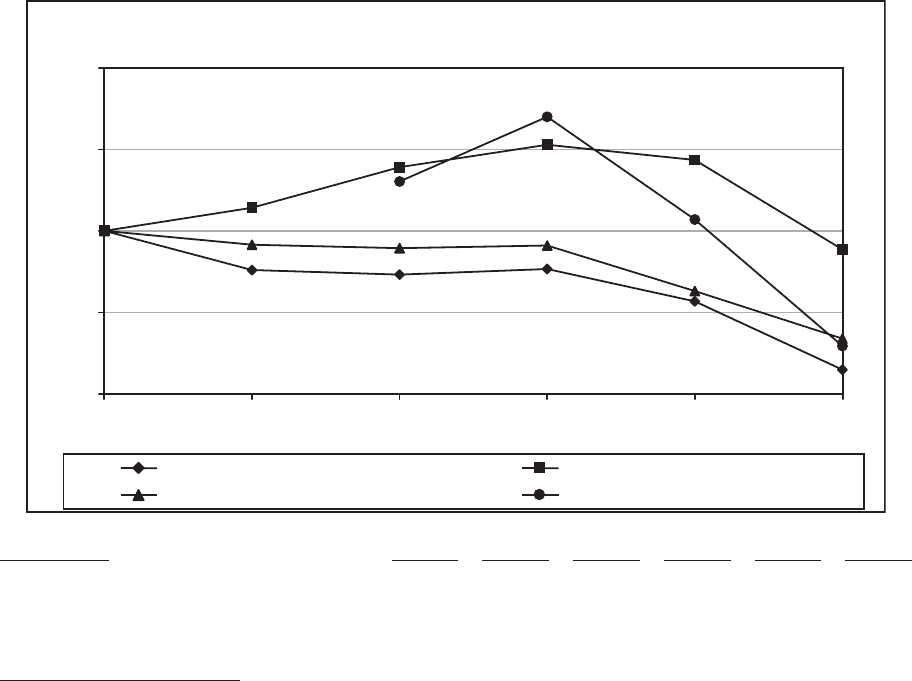
STOCK PRICE PERFORMANCE
The following graph compares the cumulative total return on shares of Pep Boys Stock over the
past five years with the cumulative total return on shares of companies in (1) the Standard & Poor’s
SmallCap 600 Index, (2) the S&P 600 Specialty Stores Index and (3) the S&P 600 Automotive Retail
Index. Pep Boys moved from the S&P 600 Specialty Stores Index to the S&P 600 Automotive Retail
Index upon its formation in May 2005. Until such time as the S&P 600 Automotive Retail index has
five years of history, Pep Boys will show a comparison to both peer group indexes. The comparison
assumes that $100 was invested in January 2004 in Pep Boys Stock and in each of the indices and
assumes reinvestment of dividends. The companies currently comprising the S&P 600 Automotive
Retail Index are: Group 1 Automotive, Inc.; Lithia Motors, Inc.; Midas, Inc.; Sonic Automotive, Inc.;
and The Pep Boys—Manny, Moe & Jack.
Comparison of Cumulative Five Year Total Return
$200
$150
$100
$50
$0
Jan-04 Jan-05 Jan-06 Jan-07 Jan-08 Jan-09
Pep Boys
S&P 600 Specialty Stores Index
S&P SmallCap 600 Index
S&P 600 Automotive Retail Index
Company/Index Jan. 2004 Jan. 2005 Jan. 2006 Jan. 2007 Jan. 2008 Jan. 2009
Pep Boys ........................ $100 $ 75.95 $ 73.13 $ 76.57 $ 56.70 $14.73
S&P SmallCap 600 Index ............ $100 $114.20 $139.12 $152.90 $143.55 $88.59
S&P 600 Specialty Stores Index ....... $100 $ 91.49 $ 89.38 $ 91.01 $ 63.04 $33.83
S&P 600 Automotive Retail Index* ..... $ 100 $130.35 $170.07 $106.98 $29.30
* The S&P 600 Automotive Retail Index was created in May 2005. Therefore, the total return for
January 2006 is for the period from May 2005 through January 2006.
15