Pep Boys 2008 Annual Report Download - page 120
Download and view the complete annual report
Please find page 120 of the 2008 Pep Boys annual report below. You can navigate through the pages in the report by either clicking on the pages listed below, or by using the keyword search tool below to find specific information within the annual report.-
 1
1 -
2
-
3
-
4
-
5
-
6
-
7
-
8
-
9
-
10
-
11
-
12
-
13
-
14
-
15
-
16
-
17
-
18
-
19
-
20
-
21
-
22
-
23
-
24
-
25
-
26
-
27
-
28
-
29
-
30
-
31
-
32
-
33
-
34
-
35
-
36
-
37
-
38
-
39
-
40
-
41
-
42
-
43
-
44
-
45
-
46
-
47
-
48
-
49
-
50
-
51
-
52
-
53
-
54
-
55
-
56
-
57
-
58
-
59
-
60
-
61
-
62
-
63
-
64
-
65
-
66
-
67
-
68
-
69
-
70
-
71
-
72
-
73
-
74
-
75
-
76
-
77
-
78
-
79
-
80
-
81
-
82
-
83
-
84
-
85
-
86
-
87
-
88
-
89
-
90
-
91
-
92
-
93
-
94
-
95
-
96
-
97
-
98
-
99
-
100
-
101
-
102
-
103
-
104
-
105
-
106
-
107
-
108
-
109
-
 110
110 -
 111
111 -
 112
112 -
 113
113 -
 114
114 -
 115
115 -
 116
116 -
 117
117 -
 118
118 -
 119
119 -
 120
120 -
 121
121 -
 122
122 -
 123
123 -
 124
124 -
 125
125 -
 126
126 -
 127
127 -
 128
128 -
 129
129 -
 130
130 -
131
-
132
-
133
-
134
-
135
-
136
-
137
-
138
-
139
-
140
-
141
-
142
-
143
-
144
-
145
-
146
-
147
-
148
-
149
-
150
-
151
-
152
-
153
-
154
-
155
-
156
-
157
-
158
-
159
-
160
-
161
-
162
-
163
-
164
-
165
-
166
-
167
-
168
 |
 |

THE PEP BOYS—MANNY, MOE & JACK AND SUBSIDIARIES
NOTES TO CONSOLIDATED FINANCIAL STATEMENTS (Continued)
Years ended January 31, 2009, February 2, 2008 and February 3, 2007
(dollar amounts in thousands, except share data)
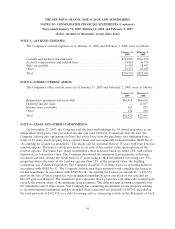
separate lease and was separately evaluated under SFAS No.13. The leases have an initial term of
15 years with four five-year renewal options. The leases have yearly incremental rental increases that
are 1.5% of the prior year’s rentals. The second through the fourth renewal options are at fair market
rents. The Company discounted the minimum lease payments, reflecting escalation amounts, during the
initial term of 15 years using its then incremental borrowing rate. For properties where the value of the
land was greater than 25% of the property value, the building component was evaluated separately.
The Company classified 21 of these leases as operating leases in accordance with SFAS No.13. The
Company actively uses these properties and considers the leases as normal leasebacks. In accordance
with SFAS No.98, a $2,124 gain on the sale of these properties was recognized immediately upon
execution of the sale and a $28,638 gain was deferred. The immediate gain represents those properties
sold where the realized gain exceeds the present value of the minimum lease payments. The deferred
gain is being recognized over the minimum term of these leases. The Company initially had continuing
involvement in one property relating to an environmental indemnity and, accordingly, recorded $3,896
of the transaction’s total net proceeds as a borrowing and as a financing activity in the Statement of
Cash Flows. During the third quarter of 2008, the Company provided the necessary documentation to
satisfy its indemnity and removed its continuing involvement with this property. The Company then
recorded the sale of this property as a sale-leaseback transaction, removing the asset and related lease
financing and recorded a $2,448 deferred gain which is being recognized over the remaining minimum
term of this lease.
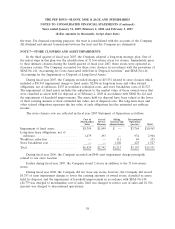
During the second quarter of fiscal year 2008, the Company completed a sale-leaseback transaction
for 22 stores. The $75,951 net proceeds were used to finance, together with $41,170 of cash on hand,
the purchase of the 29 properties for $117,121 that were previously leased under a master operating
lease.
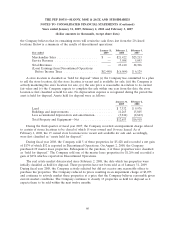
The net book values of assets under capital leases and sale-leaseback transactions accounted for
under the financing method are summarized as follows:
January 31, February 2,
2009 2008
Land................................................ $1,859 $ 1,859
Buildings ............................................. 2,258 2,258
Equipment ............................................ 2,349 2,349
Accumulated depreciation ................................. (2,829) (2,430)
Net book value ........................................ $3,637 $ 4,036
56