Pep Boys 2008 Annual Report Download - page 81
Download and view the complete annual report
Please find page 81 of the 2008 Pep Boys annual report below. You can navigate through the pages in the report by either clicking on the pages listed below, or by using the keyword search tool below to find specific information within the annual report.-
 1
1 -
2
-
3
-
4
-
5
-
6
-
7
-
8
-
9
-
10
-
11
-
12
-
13
-
14
-
15
-
16
-
17
-
18
-
19
-
20
-
21
-
22
-
23
-
24
-
25
-
26
-
27
-
28
-
29
-
30
-
31
-
32
-
33
-
34
-
35
-
36
-
37
-
38
-
39
-
40
-
41
-
42
-
43
-
44
-
45
-
46
-
47
-
48
-
49
-
50
-
51
-
52
-
53
-
54
-
55
-
56
-
57
-
58
-
59
-
60
-
61
-
62
-
63
-
64
-
65
-
66
-
67
-
68
-
69
-
70
-
 71
71 -
 72
72 -
 73
73 -
 74
74 -
 75
75 -
 76
76 -
 77
77 -
 78
78 -
 79
79 -
 80
80 -
 81
81 -
 82
82 -
 83
83 -
 84
84 -
 85
85 -
 86
86 -
 87
87 -
 88
88 -
 89
89 -
 90
90 -
 91
91 -
92
-
93
-
94
-
95
-
96
-
97
-
98
-
99
-
100
-
101
-
102
-
103
-
104
-
105
-
106
-
107
-
108
-
109
-
110
-
111
-
112
-
113
-
114
-
115
-
116
-
117
-
118
-
119
-
120
-
121
-
122
-
123
-
124
-
125
-
126
-
127
-
128
-
129
-
130
-
131
-
132
-
133
-
134
-
135
-
136
-
137
-
138
-
139
-
140
-
141
-
142
-
143
-
144
-
145
-
146
-
147
-
148
-
149
-
150
-
151
-
152
-
153
-
154
-
155
-
156
-
157
-
158
-
159
-
160
-
161
-
162
-
163
-
164
-
165
-
166
-
167
-
168
 |
 |
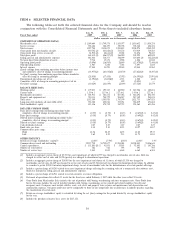
ITEM 7 MANAGEMENT’S DISCUSSION AND ANALYSIS OF FINANCIAL CONDITION AND
RESULTS OF OPERATIONS
OVERVIEW
Introduction
Pep Boys is a leader in the automotive aftermarket, with 562 locations, housing 5,845 service bays,
located throughout 35 states and Puerto Rico. All of our stores feature the nationally recognized Pep
Boys brand name, established through more than 85 years of providing high-quality automotive
merchandise and services, and are company-owned, ensuring chain-wide consistency for our customers.
We are the only national chain offering automotive service, accessories, tires and parts under one roof,
positioning us to achieve our goal of becoming the automotive solutions provider of choice for the
value-oriented customer. In most of our stores we also have a commercial sales program that provides
commercial credit and prompt delivery of tires, parts and other products to local, regional and national
repair garages and dealers.
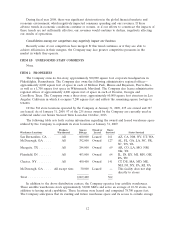
Of our 562 stores, 552 are what we refer to as SUPERCENTERS, which feature an average of 11
state-of-the-art service bays, with an average of more than 20,000 square feet per SUPERCENTER.
Our store size allows us to display and sell a more complete offering of merchandise in a wider array
of categories than our competitors, with a comprehensive tire offering. We leverage this investment in
inventory through our ability to install what we sell in our service bays and by offering this merchandise
to both commercial and retail customers.
Our fiscal year ends on the Saturday nearest January 31, which results in an extra week every six
years. Our fiscal year ended January 31, 2009 was a 52-week year with the fourth quarter including
13 weeks. Fiscal year 2006 included 53 weeks including 14 weeks in the fourth quarter. All other years
included in this report are 52 weeks.
During fiscal 2008, we continued to focus on the key drivers of our long-term strategic plan—
improving operational execution, expanding our hard parts assortment and developing a service center
growth strategy. We continued to reinforce the importance of improving the customer shopping
experience by focusing on continuous training on product knowledge, leadership and customer
satisfaction. We made progress on our category management initiatives by completing our store
remodel program, updating category line reviews and expanding our parts assortment. We also
conducted extensive marketing tests to develop a tailored marketing plan for each of our markets in
2009 to maximize our reach and efficiencies. We also announced plans to add 20 to 40 service only
‘‘spokes’’ in fiscal year 2009 to complement our existing SUPERCENTER store base.
Our net loss per share for the fiscal year ended January 31, 2009 was $0.58 per share or a $0.21
per share improvement over the $0.79 loss per share recorded in fiscal year 2007 (See ‘‘Results of
Operations’’).
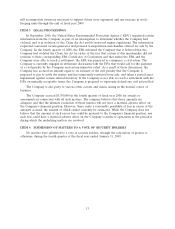
In addition we continued our real estate monetization program by completing additional sale
leaseback transactions on 63 properties in the first half of fiscal year 2008 for net proceeds of
$211,470,000. The proceeds from these transactions were used to further reduce overall indebtedness,
to satisfy our obligation under the master operating lease and for other capital expenditures.
CAPITAL & LIQUIDITY
Capital Resources and Needs
Our cash requirements arise principally from the purchase of inventory, capital expenditures
related to existing and new stores, offices and distribution centers, debt service and contractual
obligations.
17