Pep Boys 2008 Annual Report Download - page 147
Download and view the complete annual report
Please find page 147 of the 2008 Pep Boys annual report below. You can navigate through the pages in the report by either clicking on the pages listed below, or by using the keyword search tool below to find specific information within the annual report.-
 1
1 -
2
-
3
-
4
-
5
-
6
-
7
-
8
-
9
-
10
-
11
-
12
-
13
-
14
-
15
-
16
-
17
-
18
-
19
-
20
-
21
-
22
-
23
-
24
-
25
-
26
-
27
-
28
-
29
-
30
-
31
-
32
-
33
-
34
-
35
-
36
-
37
-
38
-
39
-
40
-
41
-
42
-
43
-
44
-
45
-
46
-
47
-
48
-
49
-
50
-
51
-
52
-
53
-
54
-
55
-
56
-
57
-
58
-
59
-
60
-
61
-
62
-
63
-
64
-
65
-
66
-
67
-
68
-
69
-
70
-
71
-
72
-
73
-
74
-
75
-
76
-
77
-
78
-
79
-
80
-
81
-
82
-
83
-
84
-
85
-
86
-
87
-
88
-
89
-
90
-
91
-
92
-
93
-
94
-
95
-
96
-
97
-
98
-
99
-
100
-
101
-
102
-
103
-
104
-
105
-
106
-
107
-
108
-
109
-
110
-
111
-
112
-
113
-
114
-
115
-
116
-
117
-
118
-
119
-
120
-
121
-
122
-
123
-
124
-
125
-
126
-
127
-
128
-
129
-
130
-
131
-
132
-
133
-
134
-
135
-
136
-
 137
137 -
 138
138 -
 139
139 -
 140
140 -
 141
141 -
 142
142 -
 143
143 -
 144
144 -
 145
145 -
 146
146 -
 147
147 -
 148
148 -
 149
149 -
 150
150 -
 151
151 -
 152
152 -
 153
153 -
 154
154 -
 155
155 -
 156
156 -
 157
157 -
158
-
159
-
160
-
161
-
162
-
163
-
164
-
165
-
166
-
167
-
168
 |
 |

THE PEP BOYS—MANNY, MOE & JACK AND SUBSIDIARIES
NOTES TO CONSOLIDATED FINANCIAL STATEMENTS (Continued)
Years ended January 31, 2009, February 2, 2008 and February 3, 2007
(dollar amounts in thousands, except share data)
SFAS No. 157, fair value is defined as the exit price, or the amount that would be received to sell an
asset or paid to transfer a liability in an orderly transaction between market participants as of the
measurement date. SFAS No. 157 also establishes a hierarchy for inputs used in measuring fair value
that maximizes the use of observable inputs and minimizes the use of unobservable inputs by requiring
that the most observable inputs be used when available. Observable inputs are inputs market
participants would use in valuing the asset or liability developed based on market data obtained from
sources independent of the Company. Unobservable inputs are inputs that reflect the Company’s
assumptions about the factors market participants would use in valuing the asset or liability developed
based upon the best information available in the circumstances. The hierarchy is broken down into
three levels. Level 1 inputs are quoted prices (unadjusted) in active markets for identical assets or
liabilities. Level 2 inputs include quoted prices for similar assets or liabilities in active markets. Level 3
inputs are unobservable inputs for the asset or liability.
Categorization within the valuation hierarchy is based upon the lowest level of input that is
significant to the fair value measurement.
Assets and Liabilities that are Measured at Fair Value on a Recurring Basis:
Effective February 3, 2008, the application of fair value under SFAS No. 157 (as amended by FSP
Nos. 157-1,157-2, and 157-3) related to the Company’s long-term investments and interest rate swap
agreements. These items were previously, and will continue to be, recorded at fair value at each
balance sheet date. The information in the following paragraphs and tables primarily addresses matters
relative to these financial assets and liabilities.
Derivative liability:
The Company has an interest rate swap which is within the scope of SFAS No. 133, ‘‘Accounting
for Derivative Instruments and Hedging Activities.’’ The Company values this swap using observable
market data to discount projected cash flows and for credit risk adjustments. The inputs used to value
our derivative fall within Level 2 of the fair value hierarchy.
Cash Equivalents:
Cash equivalents, other than credit card receivables, include highly liquid investments with an
original maturity of three months or less at acquisition. We carry these investments at cost, which
approximates fair value. As a result, we have determined that our cash equivalents in their entirety are
classified as a Level 1 within the fair value hierarchy.
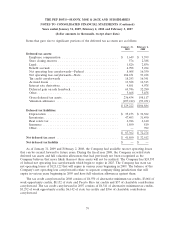
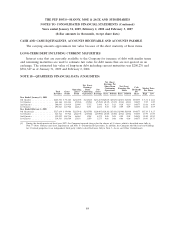
The following table provides information by level for assets and liabilities that are measured at fair
value, as defined by SFAS No. 157, on a recurring basis.
Fair Fair Value Measurements
Value at Using Inputs Considered as
(dollar amounts in thousands) January 31,
Description 2009 Level 1 Level 2 Level 3
Assets:
Cash and Cash Equivalents ........... $21,332 $21,332
Liabilities:
Other Long-term liabilities
Derivative liability .................. $15,808 $15,808
83