Pep Boys 2008 Annual Report Download - page 128
Download and view the complete annual report
Please find page 128 of the 2008 Pep Boys annual report below. You can navigate through the pages in the report by either clicking on the pages listed below, or by using the keyword search tool below to find specific information within the annual report.-
 1
1 -
2
-
3
-
4
-
5
-
6
-
7
-
8
-
9
-
10
-
11
-
12
-
13
-
14
-
15
-
16
-
17
-
18
-
19
-
20
-
21
-
22
-
23
-
24
-
25
-
26
-
27
-
28
-
29
-
30
-
31
-
32
-
33
-
34
-
35
-
36
-
37
-
38
-
39
-
40
-
41
-
42
-
43
-
44
-
45
-
46
-
47
-
48
-
49
-
50
-
51
-
52
-
53
-
54
-
55
-
56
-
57
-
58
-
59
-
60
-
61
-
62
-
63
-
64
-
65
-
66
-
67
-
68
-
69
-
70
-
71
-
72
-
73
-
74
-
75
-
76
-
77
-
78
-
79
-
80
-
81
-
82
-
83
-
84
-
85
-
86
-
87
-
88
-
89
-
90
-
91
-
92
-
93
-
94
-
95
-
96
-
97
-
98
-
99
-
100
-
101
-
102
-
103
-
104
-
105
-
106
-
107
-
108
-
109
-
110
-
111
-
112
-
113
-
114
-
115
-
116
-
117
-
 118
118 -
 119
119 -
 120
120 -
 121
121 -
 122
122 -
 123
123 -
 124
124 -
 125
125 -
 126
126 -
 127
127 -
 128
128 -
 129
129 -
 130
130 -
 131
131 -
 132
132 -
 133
133 -
 134
134 -
 135
135 -
 136
136 -
 137
137 -
 138
138 -
139
-
140
-
141
-
142
-
143
-
144
-
145
-
146
-
147
-
148
-
149
-
150
-
151
-
152
-
153
-
154
-
155
-
156
-
157
-
158
-
159
-
160
-
161
-
162
-
163
-
164
-
165
-
166
-
167
-
168
 |
 |

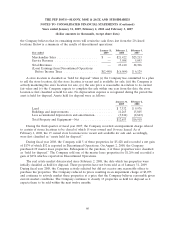
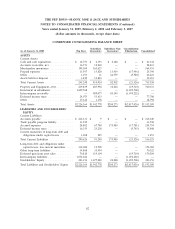
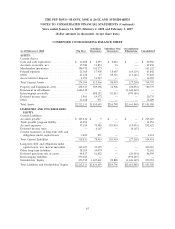
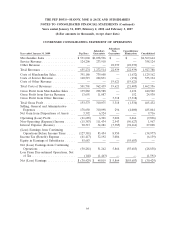
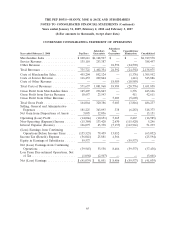
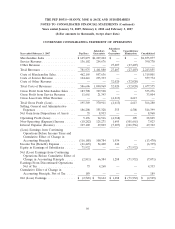
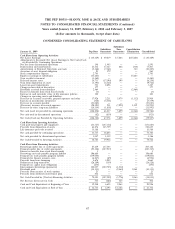
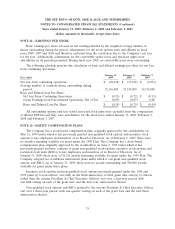
THE PEP BOYS—MANNY, MOE & JACK AND SUBSIDIARIES
NOTES TO CONSOLIDATED FINANCIAL STATEMENTS (Continued)
Years ended January 31, 2009, February 2, 2008 and February 3, 2007
(dollar amounts in thousands, except share data)
CONDENSED CONSOLIDATING STATEMENT OF OPERATIONS
Subsidiary
Subsidiary Non- Consolidation/
Year ended January 31, 2009 Pep Boys Guarantors Guarantors Elimination Consolidated
Merchandise Sales ................. $531,068 $1,038,596 $ — $ — $1,569,664
Service Revenue ................... 124,206 233,918 — — 358,124
Other Revenue .................... — — 22,939 (22,939) —
Total Revenues .................... 655,274 1,272,514 22,939 (22,939) 1,927,788
Costs of Merchandise Sales ........... 391,186 739,608 — (1,632) 1,129,162
Costs of Service Revenue ............ 110,515 222,831 — (152) 333,194
Costs of Other Revenue ............. — — 19,621 (19,621) —
Total Costs of Revenues ............. 501,701 962,439 19,621 (21,405) 1,462,356
Gross Profit from Merchandise Sales .... 139,882 298,988 — 1,632 440,502
Gross Profit from Service Revenue ..... 13,691 11,087 — 152 24,930
Gross Profit from Other Revenue ...... — — 3,318 (3,318) —
Total Gross Profit .................. 153,573 310,075 3,318 (1,534) 465,432
Selling, General and Administrative
Expenses ...................... 178,650 310,098 296 (4,000) 485,044
Net Gain from Dispositions of Assets . . . 3,392 6,324 — — 9,716
Operating (Loss) Profit .............. (21,685) 6,301 3,022 2,466 (9,896)
Non-Operating (Expense) Income ...... (15,383) 111,434 2,543 (96,627) 1,967
Interest Expense (Income) ........... 90,313 34,281 (3,385) (94,161) 27,048
(Loss) Earnings from Continuing
Operations Before Income Taxes ..... (127,381) 83,454 8,950 — (34,977)
Income Tax (Benefit) Expense ......... (41,417) 32,192 3,086 (6,139)
Equity in Earnings of Subsidiaries ...... 55,683 — — (55,683) —
Net (Loss) Earnings from Continuing
Operations ..................... (30,281) 51,262 5,864 (55,683) (28,838)
Loss From Discontinued Operations, Net
of Tax......................... (148) (1,443) — — (1,591)
Net (Loss) Earnings ................ $ (30,429) $ 49,819 $ 5,864 $(55,683) $ (30,429)
64