Pep Boys 2008 Annual Report Download - page 25
Download and view the complete annual report
Please find page 25 of the 2008 Pep Boys annual report below. You can navigate through the pages in the report by either clicking on the pages listed below, or by using the keyword search tool below to find specific information within the annual report.-
 1
1 -
2
-
3
-
4
-
5
-
6
-
7
-
8
-
9
-
10
-
11
-
12
-
13
-
14
-
 15
15 -
 16
16 -
 17
17 -
 18
18 -
 19
19 -
 20
20 -
 21
21 -
 22
22 -
 23
23 -
 24
24 -
 25
25 -
 26
26 -
 27
27 -
 28
28 -
 29
29 -
 30
30 -
 31
31 -
 32
32 -
 33
33 -
 34
34 -
 35
35 -
36
-
37
-
38
-
39
-
40
-
41
-
42
-
43
-
44
-
45
-
46
-
47
-
48
-
49
-
50
-
51
-
52
-
53
-
54
-
55
-
56
-
57
-
58
-
59
-
60
-
61
-
62
-
63
-
64
-
65
-
66
-
67
-
68
-
69
-
70
-
71
-
72
-
73
-
74
-
75
-
76
-
77
-
78
-
79
-
80
-
81
-
82
-
83
-
84
-
85
-
86
-
87
-
88
-
89
-
90
-
91
-
92
-
93
-
94
-
95
-
96
-
97
-
98
-
99
-
100
-
101
-
102
-
103
-
104
-
105
-
106
-
107
-
108
-
109
-
110
-
111
-
112
-
113
-
114
-
115
-
116
-
117
-
118
-
119
-
120
-
121
-
122
-
123
-
124
-
125
-
126
-
127
-
128
-
129
-
130
-
131
-
132
-
133
-
134
-
135
-
136
-
137
-
138
-
139
-
140
-
141
-
142
-
143
-
144
-
145
-
146
-
147
-
148
-
149
-
150
-
151
-
152
-
153
-
154
-
155
-
156
-
157
-
158
-
159
-
160
-
161
-
162
-
163
-
164
-
165
-
166
-
167
-
168
 |
 |

19
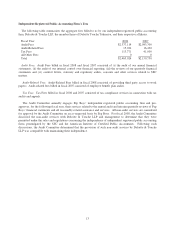
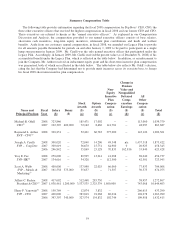
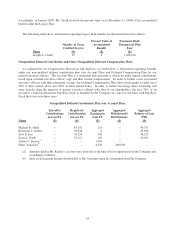
Summary Compensation Table
The following table provides information regarding the fiscal 2008 compensation for Pep Boys’ CEO, CFO, the
three other executive officers that received the highest compensation in fiscal 2008 and our former CEO and CFO.
These executives are referred to herein as the “named executive officers.” As explained in our Compensation
Discussion and Analysis, the compensation provided to our named executive officers consists of base salaries,
short-term cash incentives, long-term equity incentives, retirement plan contributions and heath and welfare
benefits. Aside from our customary annual compensation, in fiscal 2008, we amended our Legacy Plan to provide
for all amounts payable thereunder for periods on and after January 1, 2009 to be paid to participants in a single
lump sum payment in January 2009. Mr. Cirelli was the only named executive officer that participated under the
Legacy Plan. Accordingly, in January 2009, Mr. Cirelli received the present value (as of December 31, 2008) of his
accumulated benefit under the Legacy Plan, which is reflected in the table below. In addition, as an inducement to
join the Company, Mr. Arthur received an inducement equity grant and his short-term incentive plan compensation
was guaranteed, both of which are reflected in the table below. The table below also reflects Mr. Odell’s election,
citing the fact that the Company had determined not to provide merit increases across its associate base, to forego
his fiscal 2008 short-term incentive plan compensation.
Name and
Principal Position
Fiscal
Year
Salary
($)
Bonus
($)
Stock
Awards
($)
(a)
Option
Awards
($)
(b)
Non-
Equity
Incentive
Plan
Compen-
sation
($)
(c)
Change in
Pension
Value and
Nonqualified
Deferred
Comp-
ensation
Earnings
($)
(d)
All
Other
Compen-
sation
($)
(e)
Total
($)
Michael R. Odell 2008 723,846
185,471 17,002
-- -- 113,060 1,039,379
CEO(f) 2007 192,307
400,000
72,142 8,460
141,781 -- 48,997 863,687
Raymond L. Arthur 2008 369,231
-- 52,421 66,783
375,000 -- 143,126 1,006,561
EVP – CFO(g)
Joseph A. Cirelli 2008 300,020
-- 72,040 14,296
49,548 n/a 1,437,518 1,873,422
SVP – Corp.Dev. 2007 300,019
-- 56,670 15,751
64,980 0 20,925 458,345
2006 296,842
-- 35,869 23,128
70,833 162,816 33,940 623,428
Troy E. Fee 2008 250,000
-- 80,595 13,214
41,288 -- 69,640 454,737
SVP–HR(h) 2007 134,616
-- 34,328 --
112,500 -- 42,501 323,945
Scott A. Webb 2008 400,000
-- 137,990 22,025
66,060 -- 77,933 704,008
SVP – Merch. &
Marketing(i) 2007 161,538
375,000
35,657 --
71,507 -- 30,373 674,075
Jeffrey C. Rachor 2008 417,692
-- 512,468 283,750
-- -- 58,957 1,272,867
President & CEO(j)
2007 1,038,461
1,200,000
3,537,535 2,325,339
1,800,000 -- 743,068 10,644,403
Harry F. Yanowitz(k)
2008 150,769
-- 12,074 3,832
-- -- 266,615 433,290
SVP – CFO 2007 400,000
-- 383,819 91,268
86,634 -- 102,278 1,063,999
2006 397,307
340,000
327,574 154,832
102,744 -- 109,958 1,432,415