Pep Boys 2008 Annual Report Download - page 82
Download and view the complete annual report
Please find page 82 of the 2008 Pep Boys annual report below. You can navigate through the pages in the report by either clicking on the pages listed below, or by using the keyword search tool below to find specific information within the annual report.-
 1
1 -
2
-
3
-
4
-
5
-
6
-
7
-
8
-
9
-
10
-
11
-
12
-
13
-
14
-
15
-
16
-
17
-
18
-
19
-
20
-
21
-
22
-
23
-
24
-
25
-
26
-
27
-
28
-
29
-
30
-
31
-
32
-
33
-
34
-
35
-
36
-
37
-
38
-
39
-
40
-
41
-
42
-
43
-
44
-
45
-
46
-
47
-
48
-
49
-
50
-
51
-
52
-
53
-
54
-
55
-
56
-
57
-
58
-
59
-
60
-
61
-
62
-
63
-
64
-
65
-
66
-
67
-
68
-
69
-
70
-
71
-
 72
72 -
 73
73 -
 74
74 -
 75
75 -
 76
76 -
 77
77 -
 78
78 -
 79
79 -
 80
80 -
 81
81 -
 82
82 -
 83
83 -
 84
84 -
 85
85 -
 86
86 -
 87
87 -
 88
88 -
 89
89 -
 90
90 -
 91
91 -
 92
92 -
93
-
94
-
95
-
96
-
97
-
98
-
99
-
100
-
101
-
102
-
103
-
104
-
105
-
106
-
107
-
108
-
109
-
110
-
111
-
112
-
113
-
114
-
115
-
116
-
117
-
118
-
119
-
120
-
121
-
122
-
123
-
124
-
125
-
126
-
127
-
128
-
129
-
130
-
131
-
132
-
133
-
134
-
135
-
136
-
137
-
138
-
139
-
140
-
141
-
142
-
143
-
144
-
145
-
146
-
147
-
148
-
149
-
150
-
151
-
152
-
153
-
154
-
155
-
156
-
157
-
158
-
159
-
160
-
161
-
162
-
163
-
164
-
165
-
166
-
167
-
168
 |
 |
Cash flows realized through the sale of automotive parts, accessories and services is our primary
source of liquidity. Net cash used in operating activities was $39,507,000 in fiscal year 2008 while net
cash provided by operating activities was $52,784,000 in fiscal year 2007 and $92,430,000 in fiscal year
2006. The $92,291,000 decrease in cash flows from operating activities in fiscal year 2008 as compared
to fiscal year 2007 resulted from a $31,143,000 increase in our net loss (net of non-cash adjustments),
and $58,244,000 in unfavorable changes in our operating assets and liabilities. The change in operating
assets and liabilities was primarily due to an unfavorable change in merchandise inventory of
$16,865,000. The inventory change is a result of our decision to exit certain non-core inventory in the
fiscal year 2007 compounded by a decision to expand our hard parts assortment in fiscal year 2008. The
change in accounts payable of $13,017,000 was primarily attributable to the timing of our accounts
payable cycle. In addition, we expended approximately $5,000,000 to convert our vacation plan to a
paid time off plan, satisfied approximately $19,918,000 of liabilities associated with our defined benefits
executive supplemental retirement plan ($14,441,000 of the payment was to terminate the SERP) and
paid $4,539,000 in connection with reducing the notional value on an interest rate swap by $55,000,000.
In fiscal years 2008 and 2007, we generated $78,726,000 and $149,262,000, respectively, of cash
flows from investing activities, while in fiscal year 2006 we used $57,339,000 of cash in investing
activities. Fiscal years 2008 and 2007 included positive cash flow due to the sale lease back transactions
of 63 and 34 stores, respectively, for $211,470,000 and $162,918,000 in net proceeds. The proceeds in
fiscal year 2008 were used to satisfy a $117,121,000 purchase obligation under a master operating lease,
to fund other capital expenditures and to retire $26,528,000 of senior subordinated notes. The proceeds
in fiscal year 2007 were used to prepay a portion of the Company’s Senior Secured Term Loan. In
fiscal years 2008 and 2007, we also cancelled certain company-owned life insurance policies for net
proceeds of $15,588,000 and $30,045,000, respectively. The proceeds from these non-core assets were
used to satisfy our obligations under the Company’s defined benefit executive supplemental retirement
plan in the current year and to repay borrowings under our revolving credit facility and for general
corporate purposes in the prior year.
Our primary capital requirements are for new stores and for maintenance capital expenditures
related to, and the remodeling of, our existing stores, offices and distribution centers. Capital
expenditures in fiscal years 2008, 2007 and 2006 were $34,762,000 (excluding the purchase of assets
under the master lease), $43,116,000 and $49,391,000, respectively. Capital expenditures in fiscal year
2008 were lower than fiscal year 2007 as a result of fewer store remodels. At the end of fiscal year
2008, we had no material capital expenditure commitments. Our fiscal year 2009 capital expenditures
are expected to be approximately $50,000,000 which includes the addition of 20 to 40 service only
‘‘spoke’’ shops and the general maintenance of our existing stores. These expenditures are expected to
be funded from net cash generated from operating activities and the Company’s existing line of credit.
In fiscal years 2008, 2007 and 2006 we used cash of $38,813,000; $203,004,000 and $61,488,000,
respectively, in financing activities to reduce our overall indebtedness. In fiscal year 2008, we expended
$6,754,000 for financing costs associated with our new $300,000,000 credit facility. In fiscal 2007, we
repurchased $50,841,000 of our common shares and paid an additional $7,311,000 to settle shares of
our common stock repurchased in the fourth quarter of fiscal year 2006.
We anticipate that cash provided by operating activities, our existing line of credit and cash on
hand will exceed our expected cash requirements in fiscal 2009. We expect to have excess availability
under our existing line of credit during the entirety of fiscal 2009. We also have substantial owned real
estate which we believe we can monetize, if necessary, through additional sale leaseback or other
financing transactions.
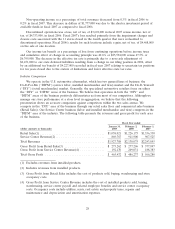
Our working capital was $179,233,000 at January 31, 2009; $195,343,000 at February 2, 2008 and
$163,960,000 at February 3, 2007. Our long-term debt, as a percentage of its total capitalization, was
45% at January 31, 2009; 46% at February 2, 2008 and 49% at February 3, 2007. As of January 31,
18