Pep Boys 2008 Annual Report Download - page 11
Download and view the complete annual report
Please find page 11 of the 2008 Pep Boys annual report below. You can navigate through the pages in the report by either clicking on the pages listed below, or by using the keyword search tool below to find specific information within the annual report.-
 1
1 -
 2
2 -
 3
3 -
 4
4 -
 5
5 -
 6
6 -
 7
7 -
 8
8 -
 9
9 -
 10
10 -
 11
11 -
 12
12 -
 13
13 -
 14
14 -
 15
15 -
 16
16 -
 17
17 -
 18
18 -
 19
19 -
 20
20 -
 21
21 -
 22
22 -
23
-
24
-
25
-
26
-
27
-
28
-
29
-
30
-
31
-
32
-
33
-
34
-
35
-
36
-
37
-
38
-
39
-
40
-
41
-
42
-
43
-
44
-
45
-
46
-
47
-
48
-
49
-
50
-
51
-
52
-
53
-
54
-
55
-
56
-
57
-
58
-
59
-
60
-
61
-
62
-
63
-
64
-
65
-
66
-
67
-
68
-
69
-
70
-
71
-
72
-
73
-
74
-
75
-
76
-
77
-
78
-
79
-
80
-
81
-
82
-
83
-
84
-
85
-
86
-
87
-
88
-
89
-
90
-
91
-
92
-
93
-
94
-
95
-
96
-
97
-
98
-
99
-
100
-
101
-
102
-
103
-
104
-
105
-
106
-
107
-
108
-
109
-
110
-
111
-
112
-
113
-
114
-
115
-
116
-
117
-
118
-
119
-
120
-
121
-
122
-
123
-
124
-
125
-
126
-
127
-
128
-
129
-
130
-
131
-
132
-
133
-
134
-
135
-
136
-
137
-
138
-
139
-
140
-
141
-
142
-
143
-
144
-
145
-
146
-
147
-
148
-
149
-
150
-
151
-
152
-
153
-
154
-
155
-
156
-
157
-
158
-
159
-
160
-
161
-
162
-
163
-
164
-
165
-
166
-
167
-
168
 |
 |

5
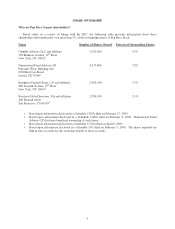
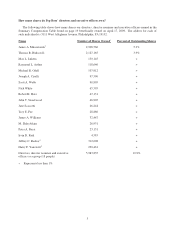
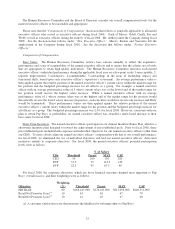
How many shares do Pep Boys’ directors and executive officers own?
The following table shows how many shares our directors, director nominee and executive officers named in the
Summary Compensation Table found on page 19 beneficially owned on April 17, 2009. The address for each of
such individuals is 3111 West Allegheny Avenue, Philadelphia, PA 19132.
Name Number of Shares Owned1 Percent of Outstanding Shares
James A. Mitarotonda2 2,908,760 5.3%
Thomas R. Hudson Jr. 2,127,165 3.9%
Max L. Lukens 150,145 +
Raymond L. Arthur 118,646 +
Michael R. Odell 107,912 +
Joseph A. Cirelli 97,596 +
Scott A. Webb 90,805 +
Nick White 65,395 +
Robert H. Hotz 47,131 +
John T. Sweetwood 46,905 +
Jane Scaccetti 46,244 +
Troy E. Fee 28,886 +
James A. Williams 32,467 +
M. Shân Atkins 26,931 +
Peter A. Bassi 23,131 +
Irvin D. Reid 4,583 +
Jeffrey C. Rachor3 312,608 +
Harry F. Yanowitz4 229,461 +
Directors, director nominee and executive
officers as a group (18 people) 5,983,835 10.9%
+ Represents less than 1%.