Pep Boys 2008 Annual Report Download - page 104
Download and view the complete annual report
Please find page 104 of the 2008 Pep Boys annual report below. You can navigate through the pages in the report by either clicking on the pages listed below, or by using the keyword search tool below to find specific information within the annual report.-
 1
1 -
2
-
3
-
4
-
5
-
6
-
7
-
8
-
9
-
10
-
11
-
12
-
13
-
14
-
15
-
16
-
17
-
18
-
19
-
20
-
21
-
22
-
23
-
24
-
25
-
26
-
27
-
28
-
29
-
30
-
31
-
32
-
33
-
34
-
35
-
36
-
37
-
38
-
39
-
40
-
41
-
42
-
43
-
44
-
45
-
46
-
47
-
48
-
49
-
50
-
51
-
52
-
53
-
54
-
55
-
56
-
57
-
58
-
59
-
60
-
61
-
62
-
63
-
64
-
65
-
66
-
67
-
68
-
69
-
70
-
71
-
72
-
73
-
74
-
75
-
76
-
77
-
78
-
79
-
80
-
81
-
82
-
83
-
84
-
85
-
86
-
87
-
88
-
89
-
90
-
91
-
92
-
93
-
 94
94 -
 95
95 -
 96
96 -
 97
97 -
 98
98 -
 99
99 -
 100
100 -
 101
101 -
 102
102 -
 103
103 -
 104
104 -
 105
105 -
 106
106 -
 107
107 -
 108
108 -
 109
109 -
 110
110 -
 111
111 -
 112
112 -
 113
113 -
 114
114 -
115
-
116
-
117
-
118
-
119
-
120
-
121
-
122
-
123
-
124
-
125
-
126
-
127
-
128
-
129
-
130
-
131
-
132
-
133
-
134
-
135
-
136
-
137
-
138
-
139
-
140
-
141
-
142
-
143
-
144
-
145
-
146
-
147
-
148
-
149
-
150
-
151
-
152
-
153
-
154
-
155
-
156
-
157
-
158
-
159
-
160
-
161
-
162
-
163
-
164
-
165
-
166
-
167
-
168
 |
 |

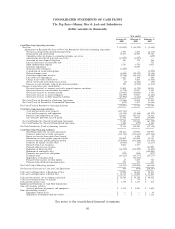
CONSOLIDATED STATEMENTS OF CASH FLOWS
The Pep Boys—Manny, Moe & Jack and Subsidiaries
(dollar amounts in thousands)
Year ended
January 31, February 2, February 3,
2009 2008 2007
Cash Flows from Operating Activities:
Net Loss ..................................................... $(30,429) $ (41,039) $ (2,549)
Adjustments to Reconcile Net Loss to Net Cash Provided by (Used in) Continuing Operations:
Net loss (earnings) from discontinued operations ........................... 1,591 3,601 (4,333)
Depreciation and amortization ...................................... 73,207 81,036 87,525
Cumulative effect of change in accounting principle, net of tax ................... — — (189)
Amortization of deferred gain from asset sales ............................ (10,285) (1,030) —
Accretion of asset disposal obligation .................................. 263 276 266
Loss on defeasance of convertible debt ................................. — — 755
Stock compensation expense ....................................... 2,743 9,756 3,051
Inventory impairment ........................................... — 32,803 —
Gain from debt retirement ........................................ (3,460) — —
Cancellation of vested stock options ................................... — — (1,056)
Deferred income taxes .......................................... (6,258) (28,187) (8,316)
Gain from dispositions of assets ..................................... (9,716) (15,151) (8,968)
Loss from asset impairment ....................................... 3,427 7,199 840
Change in fair value of derivatives .................................... 177 9,268 (5,568)
Excess tax benefits from stock based awards .............................. (3) (1,104) (95)
Increase in cash surrender value of life insurance policies ...................... 100 (4,928) (2,143)
Changes in operating assets and liabilities:
Decrease (increase) in accounts receivable, prepaid expenses and other .............. 23,904 (1,579) 24,045
(Increase) decrease in merchandise inventories ............................ (3,779) 13,087 9,250
(Decrease) increase in accounts payable ................................ (33,083) (20,066) 3,549
(Decrease) increase in accrued expenses ................................ (34,993) 10,083 (4,165)
(Decrease) increase in other long-term liabilities ........................... (11,992) (3,224) 2,093
Net Cash (Used in) Provided by Continuing Operations .......................... (38,586) 50,801 93,992
Net Cash (Used in) Provided by Discontinued Operations ........................ (921) 1,983 (1,562)
Net Cash (Used in) Provided by Operating Activities ............................. (39,507) 52,784 92,430
Cash Flows from Investing Activities:
Cash paid for master lease property ................................... (117,121) — —
Cash paid for property and equipment ................................. (34,762) (43,116) (49,391)
Proceeds from dispositions of assets ................................... 210,635 162,712 10,561
Life insurance proceeds received (paid) ................................. 15,588 30,045 (24,669)
Net Cash Provided by (Used in) Continuing Operations .......................... 74,340 149,641 (63,499)
Net Cash Provided by (Used in) Discontinued Operations ........................ 4,386 (379) 6,160
Net Cash Provided by (Used in) Investing Activities ............................. 78,726 149,262 (57,339)
Cash Flows from Financing Activities:
Borrowings under line of credit agreements .............................. 205,162 570,094 586,993
Payments under line of credit agreements ............................... (223,345) (545,617) (635,562)
Excess tax benefits from stock based awards .............................. 3 1,104 95
Borrowings on trade payable program liability ............................. 196,680 142,884 76,713
Payments on trade payable program liability .............................. (179,004) (142,620) (73,879)
Payments for finance issuance costs ................................... (6,936) (85) (2,217)
Proceeds from lease financing ...................................... 8,661 4,827 —
Proceeds from issuance of notes ..................................... — — 121,000
Reduction of long-term debt ....................................... (26,528) (165,409) (2,263)
Reduction of convertible debt ...................................... — — (119,000)
Payments on capital lease obligations .................................. (270) (286) (227)
Dividends paid ............................................... (14,111) (14,177) (14,757)
Repurchase of common stock ...................................... — (58,152) —
Proceeds from exercise of stock options ................................ 23 3,652 722
Proceeds from dividend reinvestment plan ............................... 852 781 894
Net Cash Used in Financing Activities ..................................... (38,813) (203,004) (61,488)
Net Increase (Decrease) in Cash and Cash Equivalents ........................... 406 (958) (26,397)
Cash and Cash Equivalents at Beginning of Year ............................... 20,926 21,884 48,281
Cash and Cash Equivalents at End of Year ................................... $ 21,332 $ 20,926 $ 21,884
Cash paid for interest, net of amounts capitalized ............................... $ 26,548 $ 44,129 $ 46,245
Cash received from income tax refunds ..................................... $ — $ 59 $ 1
Cash paid for income taxes ............................................ $ 1,330 $ 3,147 $ 632
Supplemental Disclosure of Cash Flow Information:
Non-cash investing activities:
Accrued purchases of property and equipment ............................. $ 1,214 $ 1,985 $ 3,691
Non-cash financing activities:
Equipment capital leases ......................................... $ — $ — $ 84
Repurchase of common stock not settled ................................ $ — $ — $ 7,311
See notes to the consolidated financial statements
40