PG&E 2015 Annual Report Download - page 96
Download and view the complete annual report
Please find page 96 of the 2015 PG&E annual report below. You can navigate through the pages in the report by either clicking on the pages listed below, or by using the keyword search tool below to find specific information within the annual report.-
 1
1 -
2
-
3
-
4
-
5
-
6
-
7
-
8
-
9
-
10
-
11
-
12
-
13
-
14
-
15
-
16
-
17
-
18
-
19
-
20
-
21
-
22
-
23
-
24
-
25
-
26
-
27
-
28
-
29
-
30
-
31
-
32
-
33
-
34
-
35
-
36
-
37
-
38
-
39
-
40
-
41
-
42
-
43
-
44
-
45
-
46
-
47
-
48
-
49
-
50
-
51
-
52
-
53
-
54
-
55
-
56
-
57
-
58
-
59
-
60
-
61
-
62
-
63
-
64
-
65
-
66
-
67
-
68
-
69
-
70
-
71
-
72
-
73
-
74
-
75
-
76
-
77
-
78
-
79
-
80
-
81
-
82
-
83
-
84
-
85
-
 86
86 -
 87
87 -
 88
88 -
 89
89 -
 90
90 -
 91
91 -
 92
92 -
 93
93 -
 94
94 -
 95
95 -
 96
96 -
 97
97 -
 98
98 -
 99
99 -
 100
100 -
 101
101 -
 102
102 -
 103
103 -
 104
104 -
 105
105 -
 106
106 -
107
-
108
-
109
-
110
-
111
-
112
-
113
-
114
-
115
-
116
-
117
-
118
-
119
-
120
-
121
-
122
-
123
-
124
-
125
-
126
-
127
-
128
-
129
-
130
-
131
-
132
-
133
-
134
-
135
-
136
-
137
-
138
-
139
-
140
-
141
-
142
-
143
-
144
-
145
-
146
-
147
-
148
-
149
-
150
-
151
-
152
 |
 |

88
PART II
ITEM 8.FINANCIAL STATEMENTS AND SUPPLEMENTARY DATA
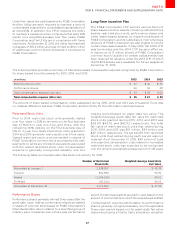
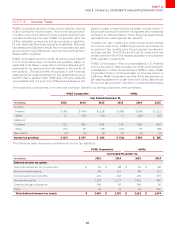
model. The weighted average grant-date fair value for
performance shares granted during 2015, 2014, and
2013 was $68.27, $51.81, and $33.45 respectively. There
was no tax benefit associated with performance shares
during each of these periods. As of December 31, 2015,
$36 million of total unrecognized compensation costs
related to nonvested performance shares was expected
to be recognized over the remaining weighted average
period of 1.45 years.
The following table summarizes activity for performance shares in 2015:
NumberofPerformance
Shares
WeightedAverageGrant-Date
FairValue
NonvestedatJanuary
Granted
Vested ()
Forfeited() ()
NonvestedatDecember
() Includesperformancesharesthatexpiredwithvalueasaresultoftotalshareholderreturnresults
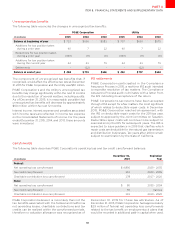
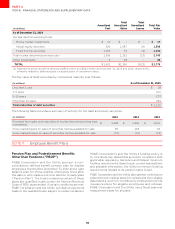
NOTE 6: Preferred Stock
PG&E Corporation has authorized 80 million shares of no
par value preferred stock and 5 million shares of $100 par
value preferred stock, which may be issued as redeemable
or nonredeemable preferred stock. PG&E Corporation
does not have any preferred stock outstanding.
The Utility has authorized 75 million shares of $25 par value
preferred stock and 10 million shares of $100 par value
preferred stock. At December 31, 2015 and December 31,
2014, the Utility’s preferred stock outstanding included
$145 million of shares with interest rates between 5% and
6% designated as nonredeemable preferred stock and
$113 million of shares with interest rates between 4.36%
and 5% that are redeemable between $25.75 and $27.25
per share. The Utility’s preferred stock outstanding are
not subject to mandatory redemption. All outstanding
preferred stock has a $25 par value.
At December 31, 2015, annual dividends on the Utility’s
nonredeemable preferred stock ranged from $1.25 to
$1.50 per share. The Utility’s redeemable preferred stock is
subject to redemption at the Utility’s option, in whole or in
part, if the Utility pays the specified redemption price plus
accumulated and unpaid dividends through the redemption
date. At December 31, 2015, annual dividends on redeemable
preferred stock ranged from $1.09 to $1.25 per share.
Dividends on all Utility preferred stock are cumulative.
All shares of preferred stock have voting rights and an
equal preference in dividend and liquidation rights. Upon
liquidation or dissolution of the Utility, holders of preferred
stock would be entitled to the par value of such shares plus
all accumulated and unpaid dividends, as specified for the
class and series. The Utility paid $14 million of dividends
on preferred stock in each of 2015, 2014, and 2013.
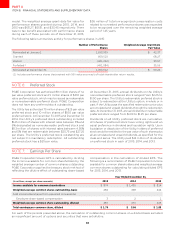
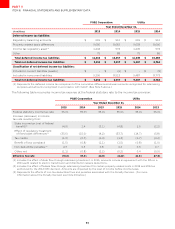
NOTE 7: Earnings Per Share
PG&E Corporation’s basic EPS is calculated by dividing
the income available for common shareholders by the
weighted average number of common shares outstanding.
PG&E Corporation applies the treasury stock method of
reflecting the dilutive eect of outstanding share-based
compensation in the calculation of diluted EPS. The
following is a reconciliation of PG&E Corporation’s income
available for common shareholders and weighted average
common shares outstanding for calculating diluted EPS
for 2015, 2014, and 2013.
YearEndedDecember
(inmillionsexceptpershareamounts)
Incomeavailableforcommonshareholders
Weightedaveragecommonsharesoutstandingbasic
Addincrementalsharesfromassumedconversions
Employeeshare-basedcompensation
Weightedaveragecommonshareoutstandingdiluted
Totalearningspercommonsharediluted
For each of the periods presented above, the calculation of outstanding common shares on a diluted basis excluded
an insignificant amount of options and securities that were antidilutive.