PG&E 2015 Annual Report Download - page 51
Download and view the complete annual report
Please find page 51 of the 2015 PG&E annual report below. You can navigate through the pages in the report by either clicking on the pages listed below, or by using the keyword search tool below to find specific information within the annual report.-
 1
1 -
2
-
3
-
4
-
5
-
6
-
7
-
8
-
9
-
10
-
11
-
12
-
13
-
14
-
15
-
16
-
17
-
18
-
19
-
20
-
21
-
22
-
23
-
24
-
25
-
26
-
27
-
28
-
29
-
30
-
31
-
32
-
33
-
34
-
35
-
36
-
37
-
38
-
39
-
40
-
 41
41 -
 42
42 -
 43
43 -
 44
44 -
 45
45 -
 46
46 -
 47
47 -
 48
48 -
 49
49 -
 50
50 -
 51
51 -
 52
52 -
 53
53 -
 54
54 -
 55
55 -
 56
56 -
 57
57 -
 58
58 -
 59
59 -
 60
60 -
 61
61 -
62
-
63
-
64
-
65
-
66
-
67
-
68
-
69
-
70
-
71
-
72
-
73
-
74
-
75
-
76
-
77
-
78
-
79
-
80
-
81
-
82
-
83
-
84
-
85
-
86
-
87
-
88
-
89
-
90
-
91
-
92
-
93
-
94
-
95
-
96
-
97
-
98
-
99
-
100
-
101
-
102
-
103
-
104
-
105
-
106
-
107
-
108
-
109
-
110
-
111
-
112
-
113
-
114
-
115
-
116
-
117
-
118
-
119
-
120
-
121
-
122
-
123
-
124
-
125
-
126
-
127
-
128
-
129
-
130
-
131
-
132
-
133
-
134
-
135
-
136
-
137
-
138
-
139
-
140
-
141
-
142
-
143
-
144
-
145
-
146
-
147
-
148
-
149
-
150
-
151
-
152
 |
 |

43
PART II
ITEM 7.MANAGEMENT’S DISCUSSION AND ANALYSIS OF FINANCIAL CONDITION AND RESULTS OF OPERATIONS
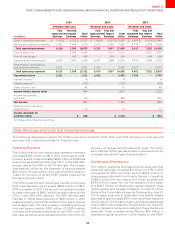
RevenuesandCosts RevenuesandCosts RevenuesandCosts
(inmillions)
That
Impacted
Earnings
ThatDid
NotImpact
Earnings
Total
Utility
That
Impacted
Earnings
ThatDid
NotImpact
Earnings
Total
Utility
That
Impacted
Earnings
ThatDid
NotImpact
Earnings
Total
Utility
Electricoperatingrevenues
Naturalgasoperatingrevenues
Totaloperatingrevenues
Costofelectricity – – –
Costofnaturalgas – – –
Operatingandmaintenance
Depreciationamortization
anddecommissioning – – –
Totaloperatingexpenses
Operatingincome – – –
Interestincome()
Interestexpense() () () ()
Otherincomenet()
Incomebeforeincometaxes
Incometax(benefit)
provision() ()
Netincome
Preferredstockdividend
requirement()
IncomeAvailablefor
CommonStock
() Theseitemsimpactedearnings
Utility Revenues and Costs that Impacted Earnings
The following discussion presents the Utility’s operating results for 2015, 2014, and 2013, focusing on revenues and
expenses that impacted earnings for these periods.
Operating Revenues
The Utility’s electric and natural gas operating revenues
increased $393 million or 4% in 2015 compared to 2014,
primarily a result of approximately $490 million of additional
base revenues as authorized by the CPUC in the 2014 GRC
decision and by the FERC in the TO rate case.This increase
was partially oset by the absence of approximately
$110million of revenues the CPUC authorized the Utility to
collect for recovery of certain PSEP-related costs during
the same period in 2014.
The Utility’s electric and natural gas operating revenues
that impacted earnings increased $890 million or 11% in
2014 compared to 2013. This amount included an increase
to base revenues of $460 million as authorized by the
CPUC in the 2014 GRC decision. The GRC decision also
resulted in higher base revenues of $150 million in 2014
related primarily to the DOE settlement for spent nuclear
fuel storage costs. The total increase in operating revenues
included approximately $150 million of PSEP-related
revenues, and revenues authorized by the FERC in the TO
rate case, as well as revenues authorized by the CPUC for
recovery of nuclear decommissioning costs. The Utility
also collected higher gas transmission revenues driven by
increased demand for gas-fired generation.
Operating and Maintenance
The Utility’s operating and maintenance expenses that
impacted earnings increased $1.2 billion or 27% in 2015
compared to 2014, primarily due to $907 million in
charges associated with the Penalty Decision, consisting
of $400million for the customer bill credit, an additional
$100 million charge for the fine payable to the state,
and $407 million of disallowed capital charges. (See
“Enforcement and Litigation Matters” in Note 13 of the
Notes to the Consolidated Financial Statements in Item8.)
The increase is also due to higher labor and benefit-related
expenses of approximately $100 million and fewer insurance
recoveries for third-party claims and associated legal
costs of $63million related to the San Bruno accident. No
further insurance recoveries related to these claims are
expected. These increases were oset by $116 million in
disallowed capital recorded in 2014 related to the PSEP.