PG&E 2015 Annual Report Download - page 64
Download and view the complete annual report
Please find page 64 of the 2015 PG&E annual report below. You can navigate through the pages in the report by either clicking on the pages listed below, or by using the keyword search tool below to find specific information within the annual report.-
 1
1 -
2
-
3
-
4
-
5
-
6
-
7
-
8
-
9
-
10
-
11
-
12
-
13
-
14
-
15
-
16
-
17
-
18
-
19
-
20
-
21
-
22
-
23
-
24
-
25
-
26
-
27
-
28
-
29
-
30
-
31
-
32
-
33
-
34
-
35
-
36
-
37
-
38
-
39
-
40
-
41
-
42
-
43
-
44
-
45
-
46
-
47
-
48
-
49
-
50
-
51
-
52
-
53
-
 54
54 -
 55
55 -
 56
56 -
 57
57 -
 58
58 -
 59
59 -
 60
60 -
 61
61 -
 62
62 -
 63
63 -
 64
64 -
 65
65 -
 66
66 -
 67
67 -
 68
68 -
 69
69 -
 70
70 -
 71
71 -
 72
72 -
 73
73 -
 74
74 -
75
-
76
-
77
-
78
-
79
-
80
-
81
-
82
-
83
-
84
-
85
-
86
-
87
-
88
-
89
-
90
-
91
-
92
-
93
-
94
-
95
-
96
-
97
-
98
-
99
-
100
-
101
-
102
-
103
-
104
-
105
-
106
-
107
-
108
-
109
-
110
-
111
-
112
-
113
-
114
-
115
-
116
-
117
-
118
-
119
-
120
-
121
-
122
-
123
-
124
-
125
-
126
-
127
-
128
-
129
-
130
-
131
-
132
-
133
-
134
-
135
-
136
-
137
-
138
-
139
-
140
-
141
-
142
-
143
-
144
-
145
-
146
-
147
-
148
-
149
-
150
-
151
-
152
 |
 |

56
PART II
ITEM 7.MANAGEMENT’S DISCUSSION AND ANALYSIS OF FINANCIAL CONDITION AND RESULTS OF OPERATIONS
the impact on net income over the next 12 months would be
$11 million and $9 million, respectively, based on net variable
rate debt and other interest rate-sensitive instruments
outstanding. (See Note 4 of the Notes to the Consolidated
Financial Statements in Item 8 for further discussion of
interest rates.)
Energy Procurement Credit Risk
The Utility conducts business with counterparties mainly
in the energy industry, including the CAISO market, other
California investor-owned electric utilities, municipal
utilities, energy trading companies, financial institutions,
electricity generation companies, and oil and natural
gas production companies located in the United States
and Canada. If a counterparty fails to perform on its
contractual obligation to deliver electricity or gas, then
the Utility may find it necessary to procure electricity or
gas at current market prices, which may be higher than
the contract prices.
The Utility manages credit risk associated with its
counterparties by assigning credit limits based on
evaluations of their financial conditions, net worth, credit
ratings, and other credit criteria as deemed appropriate.
Credit limits and credit quality are monitored periodically.
The Utility executes many energy contracts under master
commodity enabling agreements that may require
security (referred to as “Credit Collateral” in the table
below). Credit collateral may be in the form of cash or
letters of credit. The Utility may accept other forms
of performance assurance in the form of corporate
guarantees of acceptable credit quality or other eligible
securities (as deemed appropriate by the Utility). Credit
collateral or performance assurance may be required
from counterparties when current net receivables and
replacement cost exposure exceed contractually specified
limits.
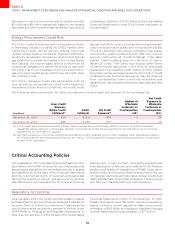
The following table summarizes the Utility’s energy procurement credit risk exposure to its counterparties:
(inmillions)
GrossCredit
Exposure
BeforeCredit
Collateral
()
Credit
Collateral
NetCredit
Exposure
()
Numberof
Wholesale
Customersor
Counterparties
NetCredit
Exposureto
Wholesale
Customersor
Counterparties
December ()
December ()
()Grosscreditexposureequalsmark-to-marketvalueonphysicallyandfinanciallysettledcontractsandnetreceivables
(payables)wherenettingiscontractuallyallowedGrossandnetcreditexposureamountsreportedabovedonotinclude
adjustmentsfortimevalueorliquidity
()NetcreditexposureistheGrossCreditExposureBeforeCreditCollateralminusCreditCollateral(cashdepositsandletters
ofcreditpostedbycounterpartiesandheldbytheUtility)Forpurposesofthistableparentalguaranteesarenotincluded
aspartofthecalculation
Critical Accounting Policies
The preparation of Consolidated Financial Statements in
accordance with GAAP involves the use of estimates and
assumptions that aect the recorded amounts of assets
and liabilities as of the date of the financial statements
and the reported amounts of revenues and expenses
during the reporting period. The accounting policies
described below are considered to be critical accounting
policies due, in part, to their complexity and because
their application is relevant and material to the financial
position and results of operations of PG&E Corporation
and the Utility, and because these policies require the use
of material judgments and estimates. Actual results may
dier substantially from these estimates. These policies
and their key characteristics are outlined below.
Regulatory Accounting
As a regulated entity, the Utility records regulatory assets
and liabilities for amounts that are deemed probable of
recovery from, or refund to, customers. These amounts
would otherwise be recorded to expense or income under
GAAP. Refer to “Regulation and Regulated Operations” in
Note 2 as well as Note 3 of the Notes to the Consolidated
Financial Statements in Item 8. At December 31, 2015,
PG&E Corporation and the Utility reported regulatory
assets (including current regulatory balancing accounts
receivable) of $9.3 billion and regulatory liabilities (including
current balancing accounts payable) of $7.7 billion.