PG&E 2015 Annual Report Download - page 101
Download and view the complete annual report
Please find page 101 of the 2015 PG&E annual report below. You can navigate through the pages in the report by either clicking on the pages listed below, or by using the keyword search tool below to find specific information within the annual report.-
 1
1 -
2
-
3
-
4
-
5
-
6
-
7
-
8
-
9
-
10
-
11
-
12
-
13
-
14
-
15
-
16
-
17
-
18
-
19
-
20
-
21
-
22
-
23
-
24
-
25
-
26
-
27
-
28
-
29
-
30
-
31
-
32
-
33
-
34
-
35
-
36
-
37
-
38
-
39
-
40
-
41
-
42
-
43
-
44
-
45
-
46
-
47
-
48
-
49
-
50
-
51
-
52
-
53
-
54
-
55
-
56
-
57
-
58
-
59
-
60
-
61
-
62
-
63
-
64
-
65
-
66
-
67
-
68
-
69
-
70
-
71
-
72
-
73
-
74
-
75
-
76
-
77
-
78
-
79
-
80
-
81
-
82
-
83
-
84
-
85
-
86
-
87
-
88
-
89
-
90
-
 91
91 -
 92
92 -
 93
93 -
 94
94 -
 95
95 -
 96
96 -
 97
97 -
 98
98 -
 99
99 -
 100
100 -
 101
101 -
 102
102 -
 103
103 -
 104
104 -
 105
105 -
 106
106 -
 107
107 -
 108
108 -
 109
109 -
 110
110 -
 111
111 -
112
-
113
-
114
-
115
-
116
-
117
-
118
-
119
-
120
-
121
-
122
-
123
-
124
-
125
-
126
-
127
-
128
-
129
-
130
-
131
-
132
-
133
-
134
-
135
-
136
-
137
-
138
-
139
-
140
-
141
-
142
-
143
-
144
-
145
-
146
-
147
-
148
-
149
-
150
-
151
-
152
 |
 |

93
PART II
ITEM 8.FINANCIAL STATEMENTS AND SUPPLEMENTARY DATA
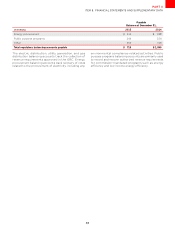
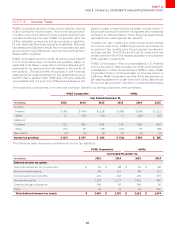
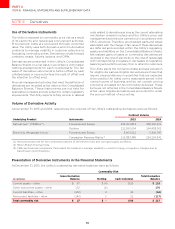
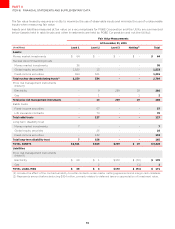
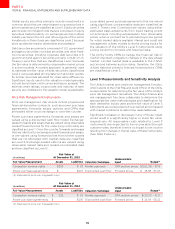
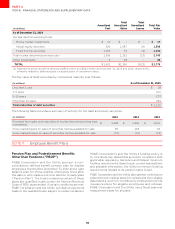
At December 31, 2014, the Utility’s outstanding derivative balances were as follows:
CommodityRisk
(inmillions)
GrossDerivative
Balance Netting CashCollateral
TotalDerivative
Balance
Currentassets–other ()
Othernoncurrentassets–other () -
Currentliabilities–other () ()
Noncurrentliabilities–other () ()
Totalcommodityrisk -
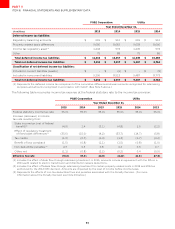
Gains and losses associated with price risk management activities were recorded as follows:
CommodityRisk
FortheyearendedDecember
(inmillions)
Unrealizedgain(loss)-regulatoryassetsandliabilities() ()
Realizedloss-costofelectricity() () () ()
Realizedloss-costofnaturalgas() () () ()
Totalcommodityrisk
()
() Unrealizedgainsandlossesoncommodityrisk-relatedderivativeinstrumentsarerecordedtoregulatoryliabilitiesorassets
respectivelyratherthanbeingrecordedtotheConsolidatedStatementsofIncomeTheseamountsexcludetheimpactof
cashcollateralpostings
() TheseamountsarefullypassedthroughtocustomersinratesAccordinglynetincomewasnotimpactedbyrealized
amountsontheseinstruments
Cash inflows and outflows associated with derivatives
are included in operating cash flows on the Utility’s
Consolidated Statements of Cash Flows.
The majority of the Utility’s derivatives contain collateral
posting provisions tied to the Utility’s credit rating from
each of the major credit rating agencies. At December
31, 2015, the Utility’s credit rating was investment grade.
If the Utility’s credit rating were to fall below investment
grade, the Utility would be required to post additional
cash immediately to fully collateralize some of its net
liability derivative positions.
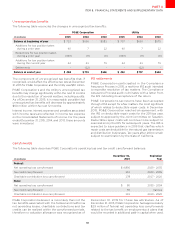
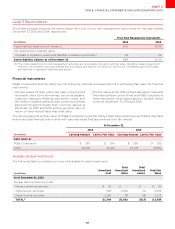
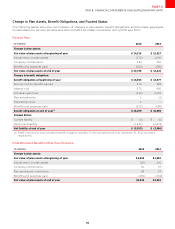
The additional cash collateral that the Utility would be
required to post if the credit risk-related contingency
features were triggered was as follows:
BalanceatDecember
(inmillions)
Derivativesinaliabilitypositionwithcreditrisk-relatedcontingenciesthatarenotfully
collateralized () ()
Relatedderivativesinanassetposition - -
Collateralpostinginthenormalcourseofbusinessrelatedtothesederivatives -
Netpositionofderivativecontractsadditionalcollateralpostingrequirements
()
() ()
() Thiscalculationexcludestheimpactofclosedbutunpaidpositionsastheirsettlementisnotimpactedbyanyofthe
Utility’screditrisk-relatedcontingencies
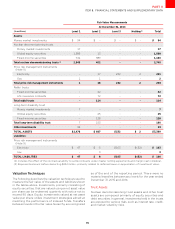
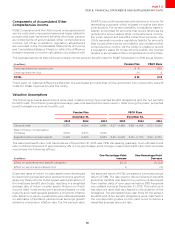
NOTE 10: Fair Value Measurements
PG&E Corporation and the Utility measure their cash equivalents, trust assets, price risk management instruments, and
other investments at fair value. A three-tier fair value hierarchy is established that prioritizes the inputs to valuation
methodologies used to measure fair value:
đ
Level 1 – Observable inputs that reflect quoted prices
(unadjusted) for identical assets or liabilities in active
markets.
đ
Level 2 – Other inputs that are directly or indirectly
observable in the marketplace.
đ
Level 3 – Unobservable inputs which are supported by
little or no market activities.