PG&E 2015 Annual Report Download - page 100
Download and view the complete annual report
Please find page 100 of the 2015 PG&E annual report below. You can navigate through the pages in the report by either clicking on the pages listed below, or by using the keyword search tool below to find specific information within the annual report.-
 1
1 -
2
-
3
-
4
-
5
-
6
-
7
-
8
-
9
-
10
-
11
-
12
-
13
-
14
-
15
-
16
-
17
-
18
-
19
-
20
-
21
-
22
-
23
-
24
-
25
-
26
-
27
-
28
-
29
-
30
-
31
-
32
-
33
-
34
-
35
-
36
-
37
-
38
-
39
-
40
-
41
-
42
-
43
-
44
-
45
-
46
-
47
-
48
-
49
-
50
-
51
-
52
-
53
-
54
-
55
-
56
-
57
-
58
-
59
-
60
-
61
-
62
-
63
-
64
-
65
-
66
-
67
-
68
-
69
-
70
-
71
-
72
-
73
-
74
-
75
-
76
-
77
-
78
-
79
-
80
-
81
-
82
-
83
-
84
-
85
-
86
-
87
-
88
-
89
-
 90
90 -
 91
91 -
 92
92 -
 93
93 -
 94
94 -
 95
95 -
 96
96 -
 97
97 -
 98
98 -
 99
99 -
 100
100 -
 101
101 -
 102
102 -
 103
103 -
 104
104 -
 105
105 -
 106
106 -
 107
107 -
 108
108 -
 109
109 -
 110
110 -
111
-
112
-
113
-
114
-
115
-
116
-
117
-
118
-
119
-
120
-
121
-
122
-
123
-
124
-
125
-
126
-
127
-
128
-
129
-
130
-
131
-
132
-
133
-
134
-
135
-
136
-
137
-
138
-
139
-
140
-
141
-
142
-
143
-
144
-
145
-
146
-
147
-
148
-
149
-
150
-
151
-
152
 |
 |

92
PART II
ITEM 8.FINANCIAL STATEMENTS AND SUPPLEMENTARY DATA
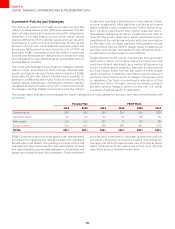
NOTE 9: Derivatives
Use of Derivative Instruments
The Utility is exposed to commodity price risk as a result
of its electricity and natural gas procurement activities.
Procurement costs are recovered through customer
rates. The Utility uses both derivative and non-derivative
contracts to manage volatility in customer rates due to
fluctuating commodity prices. Derivatives include forward
contracts, swaps, futures, options, and CRRs.
Derivatives are presented in the Utility’s Consolidated
Balance Sheets on a net basis in accordance with master
netting arrangements for each counterparty. The fair
value of derivative instruments is further oset by cash
collateral paid or received where the right of oset and
the intention to oset exist.
Price risk management activities that meet the definition of
derivatives are recorded at fair value on the Consolidated
Balance Sheets. These instruments are not held for
speculative purposes and are subject to certain regulatory
requirements. The Utility expects to fully recover in rates all
costs related to derivatives as long as the current ratemaking
mechanism remains in place and the Utility’s price risk
management activities are carried out in accordance with
CPUC directives. Therefore, all unrealized gains and losses
associated with the change in fair value of these derivatives
are deferred and recorded within the Utility’s regulatory
assets and liabilities on the Consolidated Balance Sheets.
Net realized gains or losses on commodity derivatives are
recorded in the cost of electricity or the cost of natural gas
with corresponding increases or decreases to regulatory
balancing accounts for recovery from or refund to customers.
The Utility elects the normal purchase and sale exception
for eligible derivatives. Eligible derivatives are those that
require physical delivery in quantities that are expected
to be used by the Utility over a reasonable period in the
normal course of business, and do not contain pricing
provisions unrelated to the commodity delivered. These
items are not reflected in the Consolidated Balance Sheets
at fair value. Eligible derivatives are accounted for under
the accrual method of accounting.
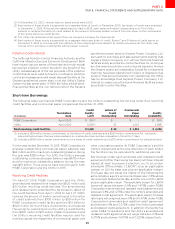
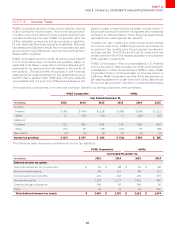
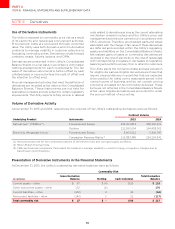
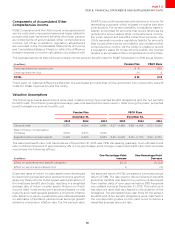
Volume of Derivative Activity
At December 31, 2015 and 2014, respectively, the volumes of the Utility’s outstanding derivatives were as follows:
ContractVolume
UnderlyingProduct Instruments
NaturalGas()(MMBtus()) ForwardsandSwaps
Options
Electricity(Megawatt-hours) ForwardsandSwaps
CongestionRevenueRights()
() Amountsshownareforthecombinedpositionsoftheelectricfuelsandcoregassupplyportfolios
() MillionBritishThermalUnits
() CRRsarefinancialinstrumentsthatenabletheholderstomanagevariabilityinelectricenergycongestionchargesdueto
transmissiongridlimitations
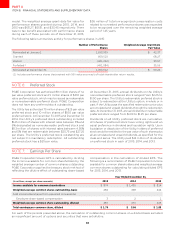
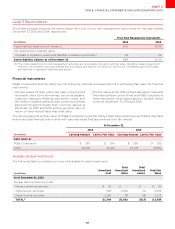
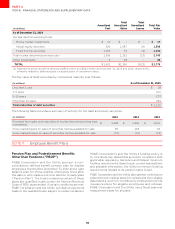
Presentation of Derivative Instruments in the Financial Statements
At December 31, 2015, the Utility’s outstanding derivative balances were as follows:
CommodityRisk
(inmillions)
GrossDerivative
Balance Netting CashCollateral
TotalDerivative
Balance
Currentassets–other ()
Othernoncurrentassets–other () -
Currentliabilities–other () ()
Noncurrentliabilities–other () ()
Totalcommodityrisk -