PG&E 2015 Annual Report Download - page 24
Download and view the complete annual report
Please find page 24 of the 2015 PG&E annual report below. You can navigate through the pages in the report by either clicking on the pages listed below, or by using the keyword search tool below to find specific information within the annual report.-
 1
1 -
2
-
3
-
4
-
5
-
6
-
7
-
8
-
9
-
10
-
11
-
12
-
13
-
 14
14 -
 15
15 -
 16
16 -
 17
17 -
 18
18 -
 19
19 -
 20
20 -
 21
21 -
 22
22 -
 23
23 -
 24
24 -
 25
25 -
 26
26 -
 27
27 -
 28
28 -
 29
29 -
 30
30 -
 31
31 -
 32
32 -
 33
33 -
 34
34 -
35
-
36
-
37
-
38
-
39
-
40
-
41
-
42
-
43
-
44
-
45
-
46
-
47
-
48
-
49
-
50
-
51
-
52
-
53
-
54
-
55
-
56
-
57
-
58
-
59
-
60
-
61
-
62
-
63
-
64
-
65
-
66
-
67
-
68
-
69
-
70
-
71
-
72
-
73
-
74
-
75
-
76
-
77
-
78
-
79
-
80
-
81
-
82
-
83
-
84
-
85
-
86
-
87
-
88
-
89
-
90
-
91
-
92
-
93
-
94
-
95
-
96
-
97
-
98
-
99
-
100
-
101
-
102
-
103
-
104
-
105
-
106
-
107
-
108
-
109
-
110
-
111
-
112
-
113
-
114
-
115
-
116
-
117
-
118
-
119
-
120
-
121
-
122
-
123
-
124
-
125
-
126
-
127
-
128
-
129
-
130
-
131
-
132
-
133
-
134
-
135
-
136
-
137
-
138
-
139
-
140
-
141
-
142
-
143
-
144
-
145
-
146
-
147
-
148
-
149
-
150
-
151
-
152
 |
 |

16
PART I
ITEM1.BUSINESS
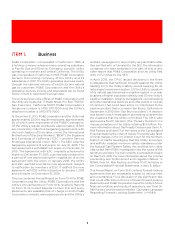
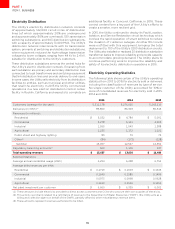
Electricity Distribution
The Utility’s electricity distribution network consists
of approximately 142,000 circuit miles of distribution
lines (of which approximately 20% are underground
and approximately 80% are overhead), 58 transmission
switching substations, and 603 distribution substations,
with a capacity of approximately 31,400 MVA. The Utility’s
distribution network interconnects with its transmission
system, primarily at switching and distribution substations,
where equipment reduces the high-voltage transmission
voltages to lower voltages, ranging from 44 kV to 2.4 kV,
suitable for distribution to the Utility’s customers.
These distribution substations serve as the central hubs for
the Utility’s electric distribution network. Emanating from
each substation are primary and secondary distribution lines
connected to local transformers and switching equipment
that link distribution lines and provide delivery to end-users.
In some cases, the Utility sells electricity from its distribution
facilities to entities, such as municipal and other utilities,
that resell the electricity. In 2015 the Utility commenced
operations in a new electric distribution control center
facility in Rocklin, California, and expects to complete an
additional facility in Concord, California, in 2016. These
control centers form a key part of the Utility’s eorts to
create a smarter, more resilient grid.
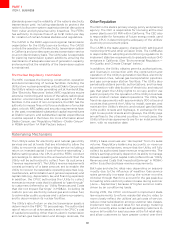
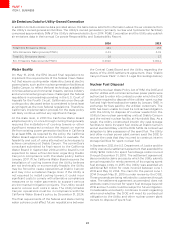
In 2015, the Utility continued to deploy its Fault Location,
Isolation, and Service Restoration circuit technology which
involves the rapid operation of smart switches to reduce
the duration of customer outages. Another 83 circuits
were outfitted with this equipment, bringing the total
deployment to 700 of the Utility’s 3200 distribution circuits.
The Utility also installed or replaced 20 distribution substation
transformer banks to improve reliability and provide capacity
to accommodate growing demand. The Utility plans to
continue performing work to improve the reliability and
safety of its electricity distribution operations in 2016.
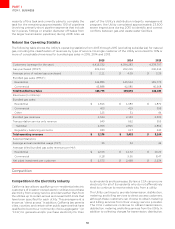
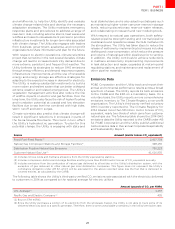
Electricity Operating Statistics
The following table shows certain of the Utility’s operating
statistics from 2013 to 2015 for electricity sold or delivered,
including the classification of revenues by type of service.
No single customer of the Utility accounted for 10% or
more of consolidated revenues for electricity sold in 2015,
2014 and 2013.
Customers(averagefortheyear)
Deliveries(inGWh)()
Revenues(inmillions)
Residential
Commercial
Industrial
Agricultural
Public street and highway lighting
Other(2) () () ()
Subtotal
Regulatorybalancingaccounts()
Totaloperatingrevenues
SelectedStatistics
Averageannualresidentialusage(kWh)
AveragebilledrevenuesperkWh
Residential
Commercial
Industrial
Agricultural
Netplantinvestmentpercustomer
() TheseamountsincludeelectricityprovidedtodirectaccesscustomersandCCAswhoprocuretheirownsuppliesofelectricity
() ThisactivityisprimarilyrelatedtoaremittanceofrevenuetotheDepartmentofWaterResources(“DWR”)(theUtilityactsasa
billingandcollectionagentonbehalfoftheDWR)partiallyoffsetbyothermiscellaneousrevenueitems
() Theseamountsrepresentrevenuesauthorizedtobebilled