PG&E 2015 Annual Report Download - page 47
Download and view the complete annual report
Please find page 47 of the 2015 PG&E annual report below. You can navigate through the pages in the report by either clicking on the pages listed below, or by using the keyword search tool below to find specific information within the annual report.-
 1
1 -
2
-
3
-
4
-
5
-
6
-
7
-
8
-
9
-
10
-
11
-
12
-
13
-
14
-
15
-
16
-
17
-
18
-
19
-
20
-
21
-
22
-
23
-
24
-
25
-
26
-
27
-
28
-
29
-
30
-
31
-
32
-
33
-
34
-
35
-
36
-
 37
37 -
 38
38 -
 39
39 -
 40
40 -
 41
41 -
 42
42 -
 43
43 -
 44
44 -
 45
45 -
 46
46 -
 47
47 -
 48
48 -
 49
49 -
 50
50 -
 51
51 -
 52
52 -
 53
53 -
 54
54 -
 55
55 -
 56
56 -
 57
57 -
58
-
59
-
60
-
61
-
62
-
63
-
64
-
65
-
66
-
67
-
68
-
69
-
70
-
71
-
72
-
73
-
74
-
75
-
76
-
77
-
78
-
79
-
80
-
81
-
82
-
83
-
84
-
85
-
86
-
87
-
88
-
89
-
90
-
91
-
92
-
93
-
94
-
95
-
96
-
97
-
98
-
99
-
100
-
101
-
102
-
103
-
104
-
105
-
106
-
107
-
108
-
109
-
110
-
111
-
112
-
113
-
114
-
115
-
116
-
117
-
118
-
119
-
120
-
121
-
122
-
123
-
124
-
125
-
126
-
127
-
128
-
129
-
130
-
131
-
132
-
133
-
134
-
135
-
136
-
137
-
138
-
139
-
140
-
141
-
142
-
143
-
144
-
145
-
146
-
147
-
148
-
149
-
150
-
151
-
152
 |
 |
39
PART II
ITEM 7.MANAGEMENT’S DISCUSSION AND ANALYSIS OF FINANCIAL CONDITION AND RESULTS OF OPERATIONS
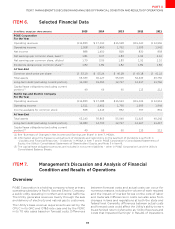
ITEM 6. Selected Financial Data
(inmillionsexceptpershareamounts)
PG&ECorporation
FortheYear
Operatingrevenues
Operatingincome
Netincome
Netearningspercommonsharebasic()
Netearningspercommonsharediluted
Dividendsdeclaredpercommonshare()
AtYear-End
Commonstockpricepershare
Totalassets
Long-termdebt(excludingcurrentportion)
Capitalleaseobligations(excludingcurrent
portion)()
PacificGasandElectricCompany
FortheYear
Operatingrevenues
Operatingincome
Incomeavailableforcommonstock
AtYear-End
Totalassets
Long-termdebt(excludingcurrentportion)
Capitalleaseobligations(excludingcurrent
portion)()
() See“SummaryofChangesinNetIncomeandEarningsperShare”inItemMD&A
() Informationaboutthefrequencyandamountofdividendsandrestrictionsonthepaymentofdividendsissetforthin
“LiquidityandFinancialResources–Dividends”inMD&AinItemandinPG&ECorporation’sConsolidatedStatementsof
EquitytheUtility’sConsolidatedStatementsofShareholders’EquityandNoteinItem
() Thecapitalleaseobligationsamountsareincludedinnoncurrentliabilities–otherinPG&ECorporation’sandtheUtility’s
ConsolidatedBalanceSheets
ITEM 7. Management’s Discussion and Analysis of Financial
Condition and Results of Operations
Overview
PG&E Corporation is a holding company whose primary
operating subsidiary is Pacific Gas and Electric Company,
a public utility operating in northern and central California.
The Utility generates revenues mainly through the sale
and delivery of electricity and natural gas to customers.
The Utility’s base revenue requirements are set by the
CPUC in its GRC and GT&S rate case and by the FERC
in its TO rate cases based on forecast costs. Dierences
between forecast costs and actual costs can occur for
numerous reasons, including the volume of work required
and the impact of market forces on the cost of labor
and materials. Dierences in costs can also arise from
changes in laws and regulations at both the state and
federal level. Generally, dierences between actual costs
and forecast costs could aect the Utility’s ability to earn
its authorized return (referred to as “Utility Revenues and
Costs that Impacted Earnings” in Results of Operations