PG&E 2015 Annual Report Download - page 29
Download and view the complete annual report
Please find page 29 of the 2015 PG&E annual report below. You can navigate through the pages in the report by either clicking on the pages listed below, or by using the keyword search tool below to find specific information within the annual report.-
 1
1 -
2
-
3
-
4
-
5
-
6
-
7
-
8
-
9
-
10
-
11
-
12
-
13
-
14
-
15
-
16
-
17
-
18
-
 19
19 -
 20
20 -
 21
21 -
 22
22 -
 23
23 -
 24
24 -
 25
25 -
 26
26 -
 27
27 -
 28
28 -
 29
29 -
 30
30 -
 31
31 -
 32
32 -
 33
33 -
 34
34 -
 35
35 -
 36
36 -
 37
37 -
 38
38 -
 39
39 -
40
-
41
-
42
-
43
-
44
-
45
-
46
-
47
-
48
-
49
-
50
-
51
-
52
-
53
-
54
-
55
-
56
-
57
-
58
-
59
-
60
-
61
-
62
-
63
-
64
-
65
-
66
-
67
-
68
-
69
-
70
-
71
-
72
-
73
-
74
-
75
-
76
-
77
-
78
-
79
-
80
-
81
-
82
-
83
-
84
-
85
-
86
-
87
-
88
-
89
-
90
-
91
-
92
-
93
-
94
-
95
-
96
-
97
-
98
-
99
-
100
-
101
-
102
-
103
-
104
-
105
-
106
-
107
-
108
-
109
-
110
-
111
-
112
-
113
-
114
-
115
-
116
-
117
-
118
-
119
-
120
-
121
-
122
-
123
-
124
-
125
-
126
-
127
-
128
-
129
-
130
-
131
-
132
-
133
-
134
-
135
-
136
-
137
-
138
-
139
-
140
-
141
-
142
-
143
-
144
-
145
-
146
-
147
-
148
-
149
-
150
-
151
-
152
 |
 |

21
PART I
ITEM1.BUSINESS
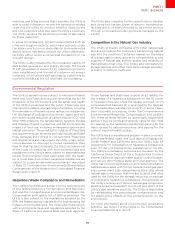
and wildfire risk, to help the Utility identify and evaluate
climate change-related risks and develop the necessary
adaptation strategies. The Utility maintains emergency
response plans and procedures to address a range of
near-term risks, including extreme storms, heat waves and
wildfires and uses its risk-assessment process to prioritize
infrastructure investments for longer-term risks associated
with climate change. The Utility also engages with leaders
from business, government, academia, and non-profit
organizations to share information and plan for the future.
With respect to electric operations, climate scientists
project that, sometime in the next several decades, climate
change will lead to increased electricity demand due to
more extreme, persistent, and frequent hot weather. The
Utility believes its strategies to reduce GHG emissions
through energy eciency and demand response programs,
infrastructure improvements, and the use of renewable
energy and energy storage are eective strategies for
adapting to the expected increase in demand for electricity.
The Utility is making substantial investments to build a
more modern and resilient system that can better withstand
extreme weather and related emergencies. The Utility’s
vegetation management activities also reduce the risk
of wildfire impacts on electric and gas facilities. Over the
long-term, the Utility also faces the risk of higher flooding
and inundation potential at coastal and low elevation
facilities due to sea level rise combined with high tides,
storm runo and storm surges.
Climate scientists also predict that climate change will
result in significant reductions in snowpack in parts of
the Sierra Nevada Mountains. This could, in turn, aect
the Utility’s hydroelectric generation. To plan for this
potential change, the Utility is engaging with state and
local stakeholders and is also adopting strategies such
as maintaining higher winter carryover reservoir storage
levels, reducing discretionary reservoir water releases,
and collaborating on research and new modeling tools.
With respect to natural gas operations, both safety-
related pipeline strength testing and normal pipeline
maintenance and operations release the GHG methane into
the atmosphere. The Utility has taken steps to reduce the
release of methane by implementing techniques including
drafting and cross-compression, which reduce the pressure
and volume of natural gas within pipelines prior to venting.
In addition, the Utility continues to achieve reductions
in methane emissions by implementing improvements
in leak detection and repair, upgrades at metering and
regulating stations, and maintenance and replacement of
other pipeline materials.
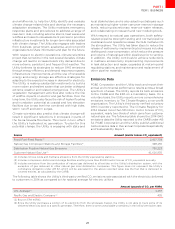
Emissions Data
PG&E Corporation and the Utility track and report their
annual environmental performance results across a broad
spectrum of areas. The Utility reports its GHG emissions
to the CARB and the EPA on a mandatory basis. On a
voluntary basis, the Utility reports a more comprehensive
emissions inventory to The Climate Registry, a non-profit
organization. The Utility’s third-party verified voluntary
GHG inventory reported to The Climate Registry for
2014 totaled more than 58 million metric tonnes of CO2
equivalent, nearly two-thirds of which came from customer
natural gas use. The following table shows the 2014 GHG
emissions data the Utility reported to the CARB under AB
32. PG&E Corporation and the Utility publish additional
GHG emissions data in their annual Corporate Responsibility
and Sustainability Report.
Source Amount(metrictonnesCO
equivalent)
FossilFuel-FiredPlants()
NaturalGasCompressorStationsandStorageFacilities()
DistributionFugitiveNaturalGasEmissions
CustomerNaturalGasUse()
() IncludesnitrousoxideandmethaneemissionsfromtheUtility’sgeneratingstations
() IncludescompressorstationsandstoragefacilitiesemittingmorethanmetrictonnesofCOequivalentannually
() IncludesemissionsfromthecombustionofnaturalgasdeliveredtoallentitiesontheUtility’sdistributionsystemwiththe
exception of gas delivered to other natural gas local distribution companies This figure does not represent the Utility’s
complianceobligationunderABwhichwillbeequivalenttotheabovereported valuelessthefuelthatisdeliveredto
coveredentitiesascalculatedbytheCARB
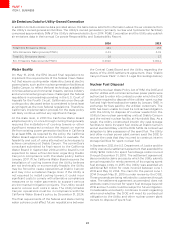
The following table shows the Utility’s third-party-verified CO
2
emissions rate associated with the electricity delivered
to customers in 2014 as compared to the national average for electric utilities:
Amount(poundsofCO
perMWh)
USAverage()
PacificGasandElectricCompany()
() SourceEPAeGRID
() SincetheUtilitypurchasesaportionofitselectricityfromthewholesalemarkettheUtilityisnotabletotracksomeof its
deliveredelectricitybacktoaspecificgeneratorThereforethereissomeunavoidableuncertaintyintheUtility’semissionsrate