PG&E 2015 Annual Report Download - page 56
Download and view the complete annual report
Please find page 56 of the 2015 PG&E annual report below. You can navigate through the pages in the report by either clicking on the pages listed below, or by using the keyword search tool below to find specific information within the annual report.-
 1
1 -
2
-
3
-
4
-
5
-
6
-
7
-
8
-
9
-
10
-
11
-
12
-
13
-
14
-
15
-
16
-
17
-
18
-
19
-
20
-
21
-
22
-
23
-
24
-
25
-
26
-
27
-
28
-
29
-
30
-
31
-
32
-
33
-
34
-
35
-
36
-
37
-
38
-
39
-
40
-
41
-
42
-
43
-
44
-
45
-
 46
46 -
 47
47 -
 48
48 -
 49
49 -
 50
50 -
 51
51 -
 52
52 -
 53
53 -
 54
54 -
 55
55 -
 56
56 -
 57
57 -
 58
58 -
 59
59 -
 60
60 -
 61
61 -
 62
62 -
 63
63 -
 64
64 -
 65
65 -
 66
66 -
67
-
68
-
69
-
70
-
71
-
72
-
73
-
74
-
75
-
76
-
77
-
78
-
79
-
80
-
81
-
82
-
83
-
84
-
85
-
86
-
87
-
88
-
89
-
90
-
91
-
92
-
93
-
94
-
95
-
96
-
97
-
98
-
99
-
100
-
101
-
102
-
103
-
104
-
105
-
106
-
107
-
108
-
109
-
110
-
111
-
112
-
113
-
114
-
115
-
116
-
117
-
118
-
119
-
120
-
121
-
122
-
123
-
124
-
125
-
126
-
127
-
128
-
129
-
130
-
131
-
132
-
133
-
134
-
135
-
136
-
137
-
138
-
139
-
140
-
141
-
142
-
143
-
144
-
145
-
146
-
147
-
148
-
149
-
150
-
151
-
152
 |
 |

48
PART II
ITEM 7.MANAGEMENT’S DISCUSSION AND ANALYSIS OF FINANCIAL CONDITION AND RESULTS OF OPERATIONS
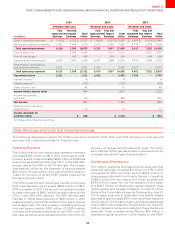
Operating Activities
The Utility’s cash flows from operating activities primarily
consist of receipts from customers less payments of
operating expenses, other than expenses such as
depreciation that do not require the use of cash. During
2015, net cash provided by operating activities increased by
$101 million compared to 2014. This increase was primarily
due to higher base revenue collections authorized in the
2014 GRC and lower purchased power costs (see “Cost of
Electricity” under “Results of Operations – Utility Revenues
and Costs that did not Impact Earnings” above), oset by
the payment of a $300 million fine to the State General
Fund as required by the Penalty Decision. During 2014,
net cash provided by operating activities increased by
$203 million compared to 2013. This increase was primarily
due to tax refunds received during 2014 compared to
tax payments made during 2013 and additional collateral
returned to the Utility in 2014 as compared to 2013, oset
by higher purchased power costs (see “Cost of Electricity”
under “Results of Operations – Utility Revenues and Costs
that did not Impact Earnings” above).
Future cash flow from operating activities will be aected
by various factors, including:
đ
the shareholder-funded bill credit of $400 million to
natural gas customers in 2016, as required by the Penalty
Decision (see “Enforcement and Litigation Matters”
in Note 13 of the Notes to the Consolidated Financial
Statements);
đ
the timing and amounts of other fines or penalties
that may be imposed in connection with the
criminal prosecution of the Utility and the remaining
investigations and other enforcement matters (see
“Enforcement and Litigation Matters” in Note 13 of
the Notes to the Consolidated Financial Statements
in Item 8 below);
đ
the timing and outcome of ratemaking proceedings,
including the 2015 GT&S rate case;
đ
the timing and amount of costs the Utility incurs, but
does not recover, associated with its natural gas system
(including costs to implement remedial measures and
$850 million to pay for designated pipeline safety projects
and programs, as required by the Penalty Decision);
đ
the timing and amount of tax payments (including the
bonus depreciation extension), tax refunds, net collateral
payments, and interest payments;
đthe timing of the resolution of the Chapter 11 disputed
claims and the amount of principal and interest on these
claims that the Utility will be required to pay.
Investing Activities
Net cash used in investing activities increased
by $412million during 2015 as compared to 2014
primarily due to an increase of $340 million in capital
expenditures and an increase in net purchases of
nuclear decommissioning trust investments in 2015
as compared to net proceeds associated with sales of
nuclear decommissioning trust investments in 2014.
Net cash used in investing activities decreased by $343
million during 2014 as compared to 2013 primarily due
a decrease of $374 million in capital expenditures. This
decrease was primarily due to lower PSEP-related capital
expenditures and the absence of additional investment
in the Utility’s photovoltaic program.
Future cash flows used in investing activities are
largely dependent on the timing and amount of capital
expenditures. The Utility estimates that it will incur between
$5.4 billion and $5.6 billion in 2016.
Financing Activities
During 2015, net cash provided by financing activities
increased by $325 million as compared to 2014. During
2014, net cash provided by financing activities decreased
by $427 million as compared to 2013. Cash provided by
or used in financing activities is driven by the Utility’s
financing needs, which depend on the level of cash
provided by or used in operating activities, the level
of cash provided by or used in investing activities, the
conditions in the capital markets, and the maturity date
of existing debt instruments. The Utility generally utilizes
long-term debt issuances and equity contributions from
PG&E Corporation to maintain its CPUC-authorized
capital structure, and relies on short-term debt to fund
temporary financing needs.