PG&E 2015 Annual Report Download - page 52
Download and view the complete annual report
Please find page 52 of the 2015 PG&E annual report below. You can navigate through the pages in the report by either clicking on the pages listed below, or by using the keyword search tool below to find specific information within the annual report.-
 1
1 -
2
-
3
-
4
-
5
-
6
-
7
-
8
-
9
-
10
-
11
-
12
-
13
-
14
-
15
-
16
-
17
-
18
-
19
-
20
-
21
-
22
-
23
-
24
-
25
-
26
-
27
-
28
-
29
-
30
-
31
-
32
-
33
-
34
-
35
-
36
-
37
-
38
-
39
-
40
-
41
-
 42
42 -
 43
43 -
 44
44 -
 45
45 -
 46
46 -
 47
47 -
 48
48 -
 49
49 -
 50
50 -
 51
51 -
 52
52 -
 53
53 -
 54
54 -
 55
55 -
 56
56 -
 57
57 -
 58
58 -
 59
59 -
 60
60 -
 61
61 -
 62
62 -
63
-
64
-
65
-
66
-
67
-
68
-
69
-
70
-
71
-
72
-
73
-
74
-
75
-
76
-
77
-
78
-
79
-
80
-
81
-
82
-
83
-
84
-
85
-
86
-
87
-
88
-
89
-
90
-
91
-
92
-
93
-
94
-
95
-
96
-
97
-
98
-
99
-
100
-
101
-
102
-
103
-
104
-
105
-
106
-
107
-
108
-
109
-
110
-
111
-
112
-
113
-
114
-
115
-
116
-
117
-
118
-
119
-
120
-
121
-
122
-
123
-
124
-
125
-
126
-
127
-
128
-
129
-
130
-
131
-
132
-
133
-
134
-
135
-
136
-
137
-
138
-
139
-
140
-
141
-
142
-
143
-
144
-
145
-
146
-
147
-
148
-
149
-
150
-
151
-
152
 |
 |

44
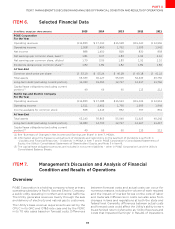
PART II
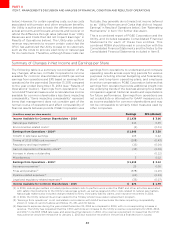
ITEM 7.MANAGEMENT’S DISCUSSION AND ANALYSIS OF FINANCIAL CONDITION AND RESULTS OF OPERATIONS
The Utility’s operating and maintenance expenses that
impacted earnings decreased $127 million or 3% in 2014
compared to 2013, primarily due to lower third-party
claims and associated legal costs of $117 million resulting
from the settlement of all outstanding third-party claims,
lower disallowed capital expenditures of $80 million and
lower insurance recoveries for third-party claims and
associated legal costs of $42 million related to the San
Bruno accident. These decreases were oset by higher
benefit-related expenses and other operating expenses
of $120 million in 2014 as compared to 2013.
Depreciation, Amortization, and Decommissioning
The Utility’s depreciation, amortization, and
decommissioning expenses increased $179 million or 7%
in 2015 compared to 2014 and $355 million or 17% in 2014
compared to 2013. In 2015, the increase was primarily due
to the impact of capital additions and higher depreciation
rates as authorized by the FERC in the TO rate case. In
2014, the increase was primarily due to higher depreciation
rates as authorized by the CPUC in the 2014 GRC decision
and higher nuclear decommissioning expense reflecting
the year-to-date increase as authorized by the CPUC in the
nuclear decommissioning triennial proceeding. Additionally,
depreciation, amortization, and decommissioning expenses
were impacted by an increase in capital additions during
2014 as compared to 2013.
Interest Expense
The Utility’s interest expenses increased by $43 million in
the year ended December 31, 2015 compared to the same
period in 2014, primarily due to the issuance of additional
long-term debt. There were no material changes to interest
expense in the year ended December 31, 2014 compared
to the same period in 2013.
Interest Income and Other Income, Net
There were no material changes to interest income and
other income, net for the periods presented.
Income Tax Provision
The Utility’s revenue requirements for the 2014 GRC
decision period reflects flow-through ratemaking
for income tax expense benefits attributable to the
accelerated recognition of repair costs and certain
other property-related costs for federal tax purposes.
PG&E Corporation and the Utility’s eective tax rates
for 2015 are lower as compared to 2014 and for 2014
as compared to 2013 and are expected to remain lower
than the statutory rate in 2016 due to these temporary
dierences.
The Utility’s income tax provision decreased $403 million
or 105% in 2015 as compared to 2014. This is primarily
the result of the statutory tax eect, $397 million, of the
lower income before income taxes in 2015 as compared
to 2014. The lower eective tax rate is the result of the tax
benefits from property-related timing dierences applied
to this lower income before income taxes.
The Utility’s income tax provision increased $58 million or
18% in 2014 as compared to 2013 primarily due to higher
income before income taxes, partially oset by certain
reductions in tax expense for flow-through treatment as
discussed above.
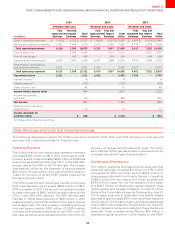
The following table reconciles the income tax expense at the federal statutory rate to the income tax provision:
Federalstatutoryincometaxrate
Increase(decrease)inincometaxrateresultingfrom
State income tax (net of federal benefit)(1) () ()
Eect of regulatory treatment of fixed asset dierences(2) () () ()
Tax credits () () ()
Benefit of loss carryback () () ()
Non-deductible penalties(3)
Other, net () ()
Eectivetaxrate ()
() Includestheeffectofstateflow-throughratemakingtreatmentInamountsreflectanagreementwiththeIRSona
auditrelatedtoelectrictransmissionanddistributionrepairsdeductions
() Includestheeffectoffederalflow-throughratemakingtreatmentforcertainproperty-relatedcostsinandas
authorizedbytheGRCdecisionAmountsareimpactedbythelevelofincomebeforeincometaxes
() Representstheeffectsofnon-taxdeductiblefinesandpenaltiesassociatedwiththePenaltyDecisionFormoreinformation
aboutthePenaltyDecisionsee“EnforcementandLitigationMatters”inNoteoftheNotestotheConsolidatedFinancial
StatementsinItem