PG&E 2015 Annual Report Download - page 105
Download and view the complete annual report
Please find page 105 of the 2015 PG&E annual report below. You can navigate through the pages in the report by either clicking on the pages listed below, or by using the keyword search tool below to find specific information within the annual report.-
 1
1 -
2
-
3
-
4
-
5
-
6
-
7
-
8
-
9
-
10
-
11
-
12
-
13
-
14
-
15
-
16
-
17
-
18
-
19
-
20
-
21
-
22
-
23
-
24
-
25
-
26
-
27
-
28
-
29
-
30
-
31
-
32
-
33
-
34
-
35
-
36
-
37
-
38
-
39
-
40
-
41
-
42
-
43
-
44
-
45
-
46
-
47
-
48
-
49
-
50
-
51
-
52
-
53
-
54
-
55
-
56
-
57
-
58
-
59
-
60
-
61
-
62
-
63
-
64
-
65
-
66
-
67
-
68
-
69
-
70
-
71
-
72
-
73
-
74
-
75
-
76
-
77
-
78
-
79
-
80
-
81
-
82
-
83
-
84
-
85
-
86
-
87
-
88
-
89
-
90
-
91
-
92
-
93
-
94
-
 95
95 -
 96
96 -
 97
97 -
 98
98 -
 99
99 -
 100
100 -
 101
101 -
 102
102 -
 103
103 -
 104
104 -
 105
105 -
 106
106 -
 107
107 -
 108
108 -
 109
109 -
 110
110 -
 111
111 -
 112
112 -
 113
113 -
 114
114 -
 115
115 -
116
-
117
-
118
-
119
-
120
-
121
-
122
-
123
-
124
-
125
-
126
-
127
-
128
-
129
-
130
-
131
-
132
-
133
-
134
-
135
-
136
-
137
-
138
-
139
-
140
-
141
-
142
-
143
-
144
-
145
-
146
-
147
-
148
-
149
-
150
-
151
-
152
 |
 |

97
PART II
ITEM 8.FINANCIAL STATEMENTS AND SUPPLEMENTARY DATA
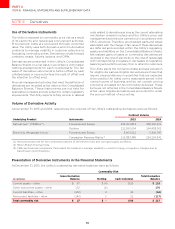
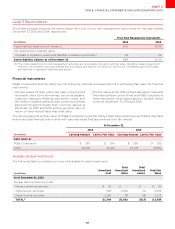
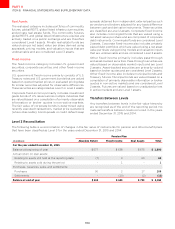
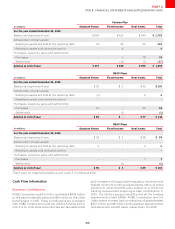
Level 3 Reconciliation
The following table presents the reconciliation for Level 3 price risk management instruments for the years ended
December 31, 2015 and 2014, respectively:
PriceRiskManagementInstruments
(inmillions)
Asset(liability)balanceasofJanuary ()
Netrealizedandunrealizedgains
Included in regulatory assets and liabilities or balancing accounts(1)
Asset(liability)balanceasofDecember
()Thecostsrelatedtopriceriskmanagementactivitiesarerecoverablethroughcustomerratesthereforebalancingaccount
revenueisrecordedforamountssettledandpurchasedandthereisnoimpacttonetincomeUnrealizedgainsandlosses
aredeferredinregulatoryliabilitiesandassets
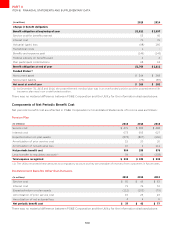
Financial Instruments
PG&E Corporation and the Utility use the following methods and assumptions in estimating fair value for financial
instruments:
đ
The fair values of cash, restricted cash, net accounts
receivable, short-term borrowings, accounts payable,
customer deposits, floating rate senior notes, and
the Utility’s variable rate pollution control bond loan
agreements approximate their carrying values at
December 31, 2015 and 2014, as they are short-term in
nature or have interest rates that reset daily.
đ
The fair values of the Utility’s fixed-rate senior notes and
fixed-rate pollution control bonds and PG&E Corporation’s
fixed-rate senior notes were based on quoted market
prices at December 31, 2015 and 2014.
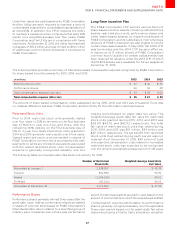
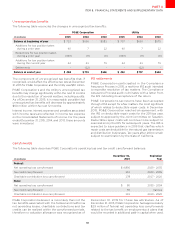
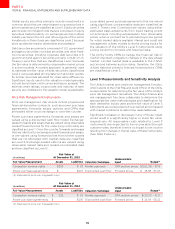
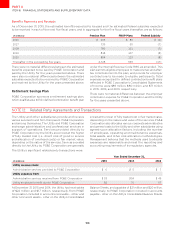
The carrying amount and fair value of PG&E Corporation’s and the Utility’s debt instruments were as follows (the table
below excludes financial instruments with carrying values that approximate their fair values):
AtDecember
(inmillions)
CarryingAmount LevelFairValue CarryingAmount LevelFairValue
Debt(Note)
PG&ECorporation
Utility
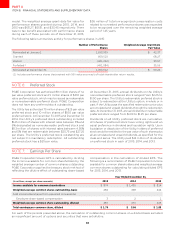
Available for Sale Investments
The following table provides a summary of available-for-sale investments:
(inmillions)
Amortized
Cost
Total
Unrealized
Gains
Total
Unrealized
Losses
TotalFair
Value
AsofDecember
Nucleardecommissioningtrusts
Money market investments - -
Global equity securities ()
Fixed-income securities ()
TOTAL(1) ()