PG&E 2015 Annual Report Download - page 112
Download and view the complete annual report
Please find page 112 of the 2015 PG&E annual report below. You can navigate through the pages in the report by either clicking on the pages listed below, or by using the keyword search tool below to find specific information within the annual report.-
 1
1 -
2
-
3
-
4
-
5
-
6
-
7
-
8
-
9
-
10
-
11
-
12
-
13
-
14
-
15
-
16
-
17
-
18
-
19
-
20
-
21
-
22
-
23
-
24
-
25
-
26
-
27
-
28
-
29
-
30
-
31
-
32
-
33
-
34
-
35
-
36
-
37
-
38
-
39
-
40
-
41
-
42
-
43
-
44
-
45
-
46
-
47
-
48
-
49
-
50
-
51
-
52
-
53
-
54
-
55
-
56
-
57
-
58
-
59
-
60
-
61
-
62
-
63
-
64
-
65
-
66
-
67
-
68
-
69
-
70
-
71
-
72
-
73
-
74
-
75
-
76
-
77
-
78
-
79
-
80
-
81
-
82
-
83
-
84
-
85
-
86
-
87
-
88
-
89
-
90
-
91
-
92
-
93
-
94
-
95
-
96
-
97
-
98
-
99
-
100
-
101
-
 102
102 -
 103
103 -
 104
104 -
 105
105 -
 106
106 -
 107
107 -
 108
108 -
 109
109 -
 110
110 -
 111
111 -
 112
112 -
 113
113 -
 114
114 -
 115
115 -
 116
116 -
 117
117 -
 118
118 -
 119
119 -
 120
120 -
 121
121 -
 122
122 -
123
-
124
-
125
-
126
-
127
-
128
-
129
-
130
-
131
-
132
-
133
-
134
-
135
-
136
-
137
-
138
-
139
-
140
-
141
-
142
-
143
-
144
-
145
-
146
-
147
-
148
-
149
-
150
-
151
-
152
 |
 |

104
PART II
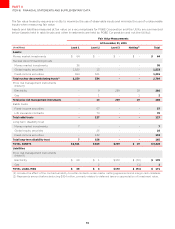
ITEM 8.FINANCIAL STATEMENTS AND SUPPLEMENTARY DATA
Real Assets
The real asset category includes portfolios of commodity
futures, global REITS, global listed infrastructure equities,
and private real estate funds. The commodity futures,
global REITS, and global listed infrastructure equities are
actively traded on a public exchange and are therefore
considered Level 1 assets. Private real estate funds are
valued using a net asset value per share derived using
appraisals, pricing models, and valuation inputs that are
unobservable and are considered Level 3 assets.
Fixed-Income
The fixed-income category includes U.S. government
securities, corporate securities, and other fixed-income
securities.
U.S. government fixed-income primarily consists of U.S.
Treasury notes and U.S. government bonds that are valued
based on quoted market prices or evaluated pricing data
for similar securities adjusted for observable dierences.
These securities are categorized as Level 1 or Level 2 assets.
Corporate fixed-income primarily includes investment
grade bonds of U.S. issuers across multiple industries that
are valued based on a compilation of primarily observable
information or broker quotes in non-active markets.
The fair value of corporate bonds is determined using
recently executed transactions, market price quotations
(where observable), bond spreads or credit default swap
spreads obtained from independent external parties such
as vendors and brokers adjusted for any basis dierence
between cash and derivative instruments. These securities
are classified as Level 2 assets. Corporate fixed-income
also includes commingled funds that are valued using a
net asset value per share and are comprised of corporate
debt instruments. Commingled funds are considered Level
2 assets. Corporate fixed-income also includes privately
placed debt portfolios which are valued using a net asset
value per share using pricing models and valuation inputs
that are unobservable and are considered Level 3 assets.
Other fixed-income primarily includes pass-through
and asset-backed securities. Pass-through securities are
valued based on observable market inputs and are Level
2 assets. Asset-backed securities are primarily valued
based on broker quotes and are considered Level 2 assets.
Other fixed-income also includes municipal bonds and
Treasury futures. Municipal bonds are valued based on a
compilation of primarily observable information or broker
quotes in non-active markets and are considered Level
2 assets. Futures are valued based on unadjusted prices
in active markets and are Level 1 assets.
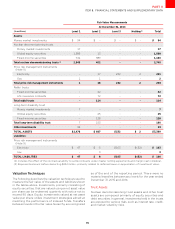
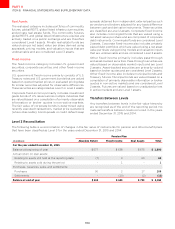
Transfers Between Levels
Any transfers between levels in the fair value hierarchy
are recognized as of the end of the reporting period. No
material transfers between levels occurred in the years
ended December 31, 2015 and 2014.
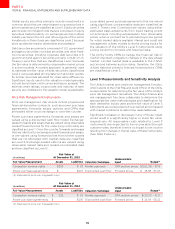
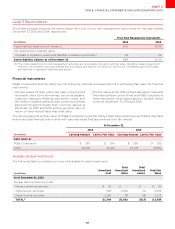
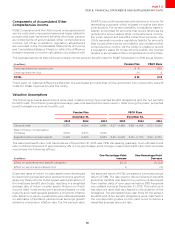
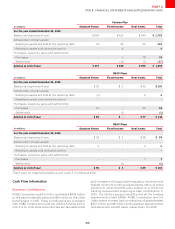
Level 3 Reconciliation
The following table is a reconciliation of changes in the fair value of instruments for pension and other benefit plans
that have been classified as Level 3 for the years ended December 31, 2015 and 2014:
PensionPlan
(inmillions) AbsoluteReturn Fixed-Income RealAssets Total
FortheyearendedDecember
Balanceatbeginningofyear
Actualreturnonplanassets
Relating to assets still held at the reporting date ()
Relating to assets sold during the period - -
Purchasesissuancessalesandsettlements
Purchases
Settlements - () () ()
Balanceatendofyear