PG&E 2015 Annual Report Download - page 67
Download and view the complete annual report
Please find page 67 of the 2015 PG&E annual report below. You can navigate through the pages in the report by either clicking on the pages listed below, or by using the keyword search tool below to find specific information within the annual report.
59
PART II
ITEM 7.MANAGEMENT’S DISCUSSION AND ANALYSIS OF FINANCIAL CONDITION AND RESULTS OF OPERATIONS
and other postretirement benefit obligations and future
plan expenses.
In establishing health care cost assumptions, PG&E
Corporation and the Utility consider recent cost trends
and projections from industry experts. This evaluation
suggests that current rates of inflation are expected to
continue in the near term. In recognition of continued
high inflation in health care costs and given the design of
PG&E Corporation’s plans, the assumed health care cost
trend rate for 2015 is 7.2%, gradually decreasing to the
ultimate trend rate of 4% in 2024 and beyond.
Expected rates of return on plan assets were developed
by estimating future stock and bond returns and then
applying these returns to the target asset allocations
of the employee benefit trusts, resulting in a weighted
average rate of return on plan assets. Fixed-income returns
were projected based on real maturity and credit spreads
added to a long-term inflation rate. Equity returns were
projected based on estimates of dividend yield and real
earnings growth added to a long-term rate of inflation.
For the Utility’s defined benefit pension plan, the assumed
return of 6.1% compares to a ten-year actual return of 7.8%.
The rate used to discount pension benefits and other
benefits was based on a yield curve developed from
market data of approximately 688 Aa-grade non-callable
bonds at December 31, 2015. This yield curve has discount
rates that vary based on the duration of the obligations.
The estimated future cash flows for the pension and
other postretirement benefit obligations were matched
to the corresponding rates on the yield curve to derive a
weighted average discount rate.
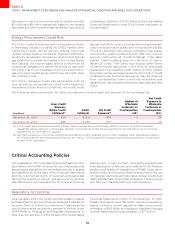
The following reflects the sensitivity of pension costs and projected benefit obligation to changes in certain actuarial
assumptions:
(inmillions)
Increase(Decrease)
inAssumption
Increasein
PensionCosts
IncreaseinProjected
BenefitObligationat
December
Discountrate ()
Rateofreturnonplanassets () -
Rateofincreaseincompensation
The following reflects the sensitivity of other postretirement benefit costs and accumulated benefit obligation to
changes in certain actuarial assumptions:
(inmillions)
Increase(Decrease)
inAssumption
Increasein
OtherPostretirement
BenefitCosts
IncreaseinAccumulated
BenefitObligationat
December
Healthcarecosttrendrate
Discountrate ()
Rateofreturnonplanassets () -
New Accounting Pronouncements
See Note 2 of the Notes to the Consolidated Financial Statements.
Cautionary Language Regarding Forward-Looking Statements
This report contains forward-looking statements that reflect
management’s judgment and opinions and management’s
knowledge of facts as of the date of this report. These
forward-looking statements relate to, among other matters,
estimated costs, including penalties and fines, associated
with various investigations and proceedings; forecasts of
pipeline-related expenses that the Utility will not recover
through rates; forecasts of capital expenditures; estimates
and assumptions used in critical accounting policies,
including those relating to regulatory assets and liabilities,
environmental remediation, litigation, third-party claims,
and other liabilities; and the level of future equity or debt
issuances. These statements are also identified by words
such as “assume,” “expect,” “intend,” “forecast,” “plan,”
“project,” “believe,” “estimate,” “predict,” “anticipate,” “may,”
“should,” “would,” “could,” “potential” and similar expressions.
These forward-looking statements are subject to various
risks and uncertainties, the realization or resolution of which
may be outside of management’s control. Actual results
could dier materially. PG&E Corporation and the Utility
are not able to predict all the factors that may aect future
results. Some of the factors that could cause future results


