Nordstrom 2013 Annual Report Download - page 62
Download and view the complete annual report
Please find page 62 of the 2013 Nordstrom annual report below. You can navigate through the pages in the report by either clicking on the pages listed below, or by using the keyword search tool below to find specific information within the annual report.-
 1
1 -
2
-
3
-
4
-
5
-
6
-
7
-
8
-
9
-
10
-
11
-
12
-
13
-
14
-
15
-
16
-
17
-
18
-
19
-
20
-
21
-
22
-
23
-
24
-
25
-
26
-
27
-
28
-
29
-
30
-
31
-
32
-
33
-
34
-
35
-
36
-
37
-
38
-
39
-
40
-
41
-
42
-
43
-
44
-
45
-
46
-
47
-
48
-
49
-
50
-
51
-
 52
52 -
 53
53 -
 54
54 -
 55
55 -
 56
56 -
 57
57 -
 58
58 -
 59
59 -
 60
60 -
 61
61 -
 62
62 -
 63
63 -
 64
64 -
 65
65 -
 66
66 -
 67
67 -
 68
68 -
 69
69 -
 70
70 -
 71
71 -
 72
72 -
73
-
74
 |
 |
62
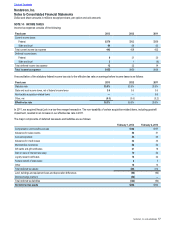
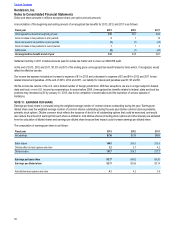
NOTE 17: SELECTED QUARTERLY DATA (UNAUDITED)
1st Quarter 2nd Quarter 3rd Quarter 4th Quarter Total
Fiscal year 2013
Net sales $2,657 $3,104 $2,791 $3,614 $12,166
Same-store sales percentage change12.7% 4.4% 0.1% 2.6% 2.5%
Credit card revenues 92 92 93 97 374
Gross profit2984 1,100 1,000 1,345 4,429
Selling, general and administrative expenses (801) (857) (840) (955) (3,453)
Earnings before income taxes 236 298 218 437 1,189
Net earnings 145 184 137 268 734
Earnings per basic share $0.74 $0.94 $0.70 $1.39 $3.77
Earnings per diluted share $0.73 $0.93 $0.69 $1.37 $3.71
Fiscal year 2012
Net sales $2,535 $2,918 $2,713 $3,596 $11,762
Same-store sales percentage change18.5% 4.5% 10.7% 6.3% 7.3%
Credit card revenues 90 88 92 102 372
Gross profit2951 1,039 983 1,357 4,330
Selling, general and administrative expenses (761) (837) (798) (961) (3,357)
Earnings before income taxes 240 250 239 456 1,185
Net earnings 149 156 146 284 735
Earnings per basic share $0.72 $0.76 $0.73 $1.43 $3.62
Earnings per diluted share $0.70 $0.75 $0.71 $1.40 $3.56
1 Same-store sales include sales from stores that have been open at least one full year at the beginning of the year. Fiscal year 2012 includes an extra week (the 53rd week) in
the fourth quarter as a result of our 4-5-4 retail reporting calendar. The 53rd week is not included in same-store sales calculations. We also include sales from our Nordstrom
online store in same-store sales because of the integration of our Nordstrom full-line stores and online store as well as HauteLook beginning in 2013.
2 Gross profit is calculated as net sales less cost of sales and related buying and occupancy costs (for all segments).
Table of Contents
Nordstrom, Inc.
Notes to Consolidated Financial Statements
Dollar and share amounts in millions except per share, per option and unit amounts