Nordstrom 2013 Annual Report Download - page 17
Download and view the complete annual report
Please find page 17 of the 2013 Nordstrom annual report below. You can navigate through the pages in the report by either clicking on the pages listed below, or by using the keyword search tool below to find specific information within the annual report.
Nordstrom, Inc. and subsidiaries 17
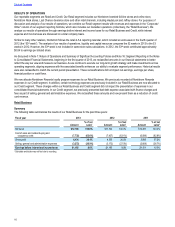
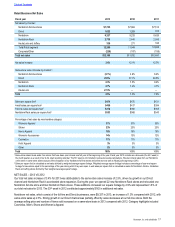
Retail Business Net Sales
Fiscal year 2013 2012 2011
Net sales by channel:
Nordstrom full-line stores $7,705 $7,964 $7,513
Direct 1,622 1,269 913
Nordstrom 9,327 9,233 8,426
Nordstrom Rack 2,738 2,445 2,045
HauteLook and Jeffrey 330 271 185
Total Retail segment 12,395 11,949 10,656
Corporate/Other (229) (187) (159)
Total net sales $12,166 $11,762 $10,497
Net sales increase 3.4% 12.1% 12.7%
Same-store sales increase by channel1:
Nordstrom full-line stores (2.1%) 3.9% 6.0%
Direct 29.5% 37.1% 29.5%
Nordstrom 2.3% 7.5% 8.2%
Nordstrom Rack 2.7% 7.4% 3.7%
HauteLook 27.3% — —
Total 2.5% 7.3% 7.2%
Sales per square foot2$474 $470 $431
4-wall sales per square foot2$408 $417 $394
Full-line sales per square foot2$372 $385 $365
Nordstrom Rack sales per square foot2$553 $568 $545
Percentage of net sales by merchandise category:
Women’s Apparel 31% 31% 33%
Shoes 23% 23% 23%
Men’s Apparel 16% 16% 15%
Women’s Accessories 14% 13% 12%
Cosmetics 11% 11% 11%
Kids’ Apparel 3% 3% 3%
Other 2% 3% 3%
Total 100% 100% 100%
1 Same-store sales include sales from stores that have been open at least one full year at the beginning of the year. Fiscal year 2012 includes an extra week (the 53rd week) in
the fourth quarter as a result of our 4-5-4 retail reporting calendar. The 53rd week is not included in same-store sales calculations. We also include sales from our Nordstrom
online store in same-store sales because of the integration of our Nordstrom full-line stores and online store as well as HauteLook beginning in 2013.
2 Sales per square foot is calculated as net sales divided by weighted-average square footage. Weighted-average square footage includes a percentage of year-end square
footage for new stores equal to the percentage of the year during which they were open. 4-wall sales per square foot is calculated as sales for Nordstrom full-line, Nordstrom
Rack and Jeffrey stores divided by their weighted-average square footage.
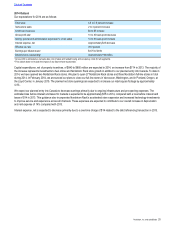
NET SALES – 2013 VS 2012
Our total net sales increase of 3.4% for 2013 was attributable to the same-store sales increase of 2.5%, driven by growth in our Direct
channel and Nordstrom Rack’s accelerated store expansion. During the year, we opened 22 new Nordstrom Rack stores and relocated one
Nordstrom full-line store and two Nordstrom Rack stores. These additions increased our square footage by 2.9% and represented 1.6% of
our total net sales for 2013. The 53rd week in 2012 contributed approximately $162 in additional net sales.
Nordstrom net sales, which consist of the full-line and Direct businesses, were $9,327 in 2013, an increase of 1.0% compared with 2012, with
same-store sales up 2.3%. Strong growth in our Direct channel was partially offset by sales decreases at our full-line stores. Both the
average selling price and number of items sold increased on a same-store basis in 2013 compared with 2012. Category highlights included
Cosmetics, Men’s Shoes and Women’s Apparel.
Table of Contents


