Nordstrom 2013 Annual Report Download - page 31
Download and view the complete annual report
Please find page 31 of the 2013 Nordstrom annual report below. You can navigate through the pages in the report by either clicking on the pages listed below, or by using the keyword search tool below to find specific information within the annual report.-
 1
1 -
2
-
3
-
4
-
5
-
6
-
7
-
8
-
9
-
10
-
11
-
12
-
13
-
14
-
15
-
16
-
17
-
18
-
19
-
20
-
 21
21 -
 22
22 -
 23
23 -
 24
24 -
 25
25 -
 26
26 -
 27
27 -
 28
28 -
 29
29 -
 30
30 -
 31
31 -
 32
32 -
 33
33 -
 34
34 -
 35
35 -
 36
36 -
 37
37 -
 38
38 -
 39
39 -
 40
40 -
 41
41 -
42
-
43
-
44
-
45
-
46
-
47
-
48
-
49
-
50
-
51
-
52
-
53
-
54
-
55
-
56
-
57
-
58
-
59
-
60
-
61
-
62
-
63
-
64
-
65
-
66
-
67
-
68
-
69
-
70
-
71
-
72
-
73
-
74
 |
 |
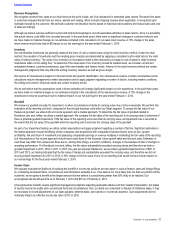
Nordstrom, Inc. and subsidiaries 31
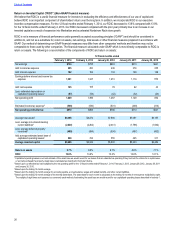
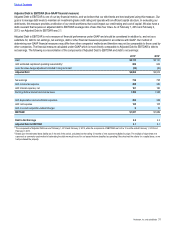
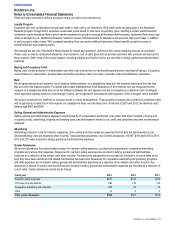
Adjusted Debt to EBITDAR (Non-GAAP financial measure)
Adjusted Debt to EBITDAR is one of our key financial metrics, and we believe that our debt levels are best analyzed using this measure. Our
goal is to manage debt levels to maintain an investment-grade credit rating and operate with an efficient capital structure. In evaluating our
debt levels, this measure provides a reflection of our credit worthiness that could impact our credit rating and cost of capital. We also have a
debt covenant that requires an adjusted debt to EBITDAR leverage ratio of less than four times. As of February 1, 2014 and February 2,
2013, our Adjusted Debt to EBITDAR was 2.1.
Adjusted Debt to EBITDAR is not a measure of financial performance under GAAP and should be considered in addition to, and not as a
substitute for, debt to net earnings, net earnings, debt or other financial measures prepared in accordance with GAAP. Our method of
determining non-GAAP financial measures may differ from other companies’ methods and therefore may not be comparable to those used by
other companies. The financial measure calculated under GAAP which is most directly comparable to Adjusted Debt to EBITDAR is debt to
net earnings. The following is a reconciliation of the components of Adjusted Debt to EBITDAR and debt to net earnings:
2013120121
Debt $3,113 $3,131
Add: estimated capitalized operating lease liability2999 843
Less: fair value hedge adjustment included in long-term debt (48) (60)
Adjusted Debt $4,064 $3,914
Net earnings 734 735
Add: income tax expense 455 450
Add: interest expense, net 161 160
Earnings before interest and income taxes 1,350 1,345
Add: depreciation and amortization expenses 454 429
Add: rent expense 125 105
Add: non-cash acquisition-related charges 810
EBITDAR $1,937 $1,889
Debt to Net Earnings 4.2 4.3
Adjusted Debt to EBITDAR 2.1 2.1
1 The components of Adjusted Debt are as of February 1, 2014 and February 2, 2013, while the components of EBITDAR are for the 12 months ended February 1, 2014 and
February 2, 2013.
2 Based upon the estimated lease liability as of the end of the period, calculated as the trailing 12 months of rent expense multiplied by eight. The multiple of eight times rent
expense is a commonly used method of estimating the debt we would record for our leases that are classified as operating if they had met the criteria for a capital lease, or we
had purchased the property.
Table of Contents