Nordstrom 2013 Annual Report Download - page 20
Download and view the complete annual report
Please find page 20 of the 2013 Nordstrom annual report below. You can navigate through the pages in the report by either clicking on the pages listed below, or by using the keyword search tool below to find specific information within the annual report.-
 1
1 -
2
-
3
-
4
-
5
-
6
-
7
-
8
-
9
-
 10
10 -
 11
11 -
 12
12 -
 13
13 -
 14
14 -
 15
15 -
 16
16 -
 17
17 -
 18
18 -
 19
19 -
 20
20 -
 21
21 -
 22
22 -
 23
23 -
 24
24 -
 25
25 -
 26
26 -
 27
27 -
 28
28 -
 29
29 -
 30
30 -
31
-
32
-
33
-
34
-
35
-
36
-
37
-
38
-
39
-
40
-
41
-
42
-
43
-
44
-
45
-
46
-
47
-
48
-
49
-
50
-
51
-
52
-
53
-
54
-
55
-
56
-
57
-
58
-
59
-
60
-
61
-
62
-
63
-
64
-
65
-
66
-
67
-
68
-
69
-
70
-
71
-
72
-
73
-
74
 |
 |

20
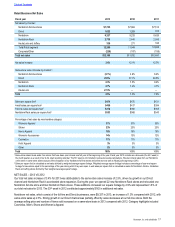
Credit Segment
The Nordstrom credit and debit card products are designed to strengthen customer relationships and grow retail sales by providing loyalty
benefits, valuable services and payment products. We believe our credit business allows us to build deeper relationships with our customers
by fully integrating our rewards program with our retail stores and providing better service, which in turn fosters greater customer loyalty. Our
cardholders tend to visit our stores more frequently and spend more with us than non-cardholders. Our Nordstrom private label credit and
debit cards can be used only at our Nordstrom full-line stores, Nordstrom Rack stores and online at Nordstrom.com (“inside volume”), while
our Nordstrom VISA cards also may be used for purchases outside of Nordstrom (“outside volume”). Cardholders participate in the
Nordstrom Rewards program through which cardholders accumulate points for their purchases. Upon reaching a certain points threshold,
cardholders receive Nordstrom Notes®, which can be redeemed for goods or services at Nordstrom full-line stores, Nordstrom Rack and
online at Nordstrom.com. Nordstrom Rewards customers receive reimbursement for alterations, get Personal Triple Points days and have
early access to sales events. With increased spending, they can receive additional amounts of these benefits as well as access to exclusive
fashion and shopping events.
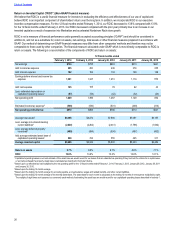
The table below provides a detailed view of the operational results of our Credit segment, consistent with the segment disclosure provided in
the Notes to Consolidated Financial Statements. In order to better reflect the economic contribution of our credit and debit card program,
intercompany merchant fees are also included in the table below, which represents the estimated costs that would be incurred if our
cardholders used third-party cards instead of ours.
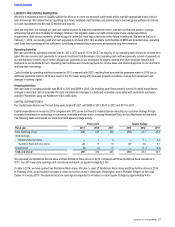
Interest expense at the Credit segment is equal to the amount of interest related to securitized debt plus an amount assigned to the Credit
segment in proportion to the estimated debt and equity needed to fund our credit card receivables. Based on our research, debt as a
percentage of credit card receivables for other credit card companies ranges from 70% to 90%. As such, we believe a mix of 80% debt and
20% equity is appropriate, and therefore assign interest expense to the Credit segment as if it carried debt of up to 80% of the credit card
receivables. Our average credit card receivable investment metric below represents the remaining 20% to fund our credit card receivables.
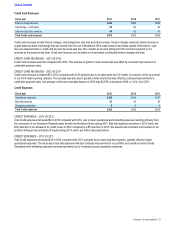
Fiscal year 2013 2012 2011
Amount
% of average
credit card
receivables1Amount
% of average
credit card
receivables1Amount
% of average
credit card
receivables1
Credit card revenues $374 17.7% $372 17.9% $363 17.7%
Credit expenses (186) (8.8%) (190) (9.1%) (215) (10.5%)
Credit segment earnings before income taxes, as
presented in segment disclosure 188 8.9% 182 8.8% 148 7.2%
Interest expense (24) (1.2%) (26) (1.2%) (13) (0.7%)
Intercompany merchant fees 97 4.6% 89 4.3% 71 3.5%
Credit segment contribution, before income taxes $261 12.4% $245 11.8% $206 10.0%
Credit and debit card volume2:
Outside $4,273 $4,305 $4,101
Inside 4,935 4,484 3,596
Total volume $9,208 $8,789 $7,697
Average credit card receivables $2,108 $2,076 $2,047
Average credit card receivable investment $422 $415 $409
Credit segment contribution338.2% 36.6% 30.6%
1 Subtotals and totals may not foot due to rounding.
2 Volume represents sales plus applicable taxes.
3 Credit segment contribution, net of tax, calculated as a percentage of our average credit card receivable investment.
Table of Contents