Nordstrom 2013 Annual Report Download - page 13
Download and view the complete annual report
Please find page 13 of the 2013 Nordstrom annual report below. You can navigate through the pages in the report by either clicking on the pages listed below, or by using the keyword search tool below to find specific information within the annual report.-
 1
1 -
2
-
 3
3 -
 4
4 -
 5
5 -
 6
6 -
 7
7 -
 8
8 -
 9
9 -
 10
10 -
 11
11 -
 12
12 -
 13
13 -
 14
14 -
 15
15 -
 16
16 -
 17
17 -
 18
18 -
 19
19 -
 20
20 -
 21
21 -
 22
22 -
 23
23 -
24
-
25
-
26
-
27
-
28
-
29
-
30
-
31
-
32
-
33
-
34
-
35
-
36
-
37
-
38
-
39
-
40
-
41
-
42
-
43
-
44
-
45
-
46
-
47
-
48
-
49
-
50
-
51
-
52
-
53
-
54
-
55
-
56
-
57
-
58
-
59
-
60
-
61
-
62
-
63
-
64
-
65
-
66
-
67
-
68
-
69
-
70
-
71
-
72
-
73
-
74
 |
 |
Nordstrom, Inc. and subsidiaries 13
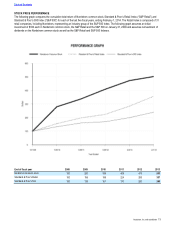
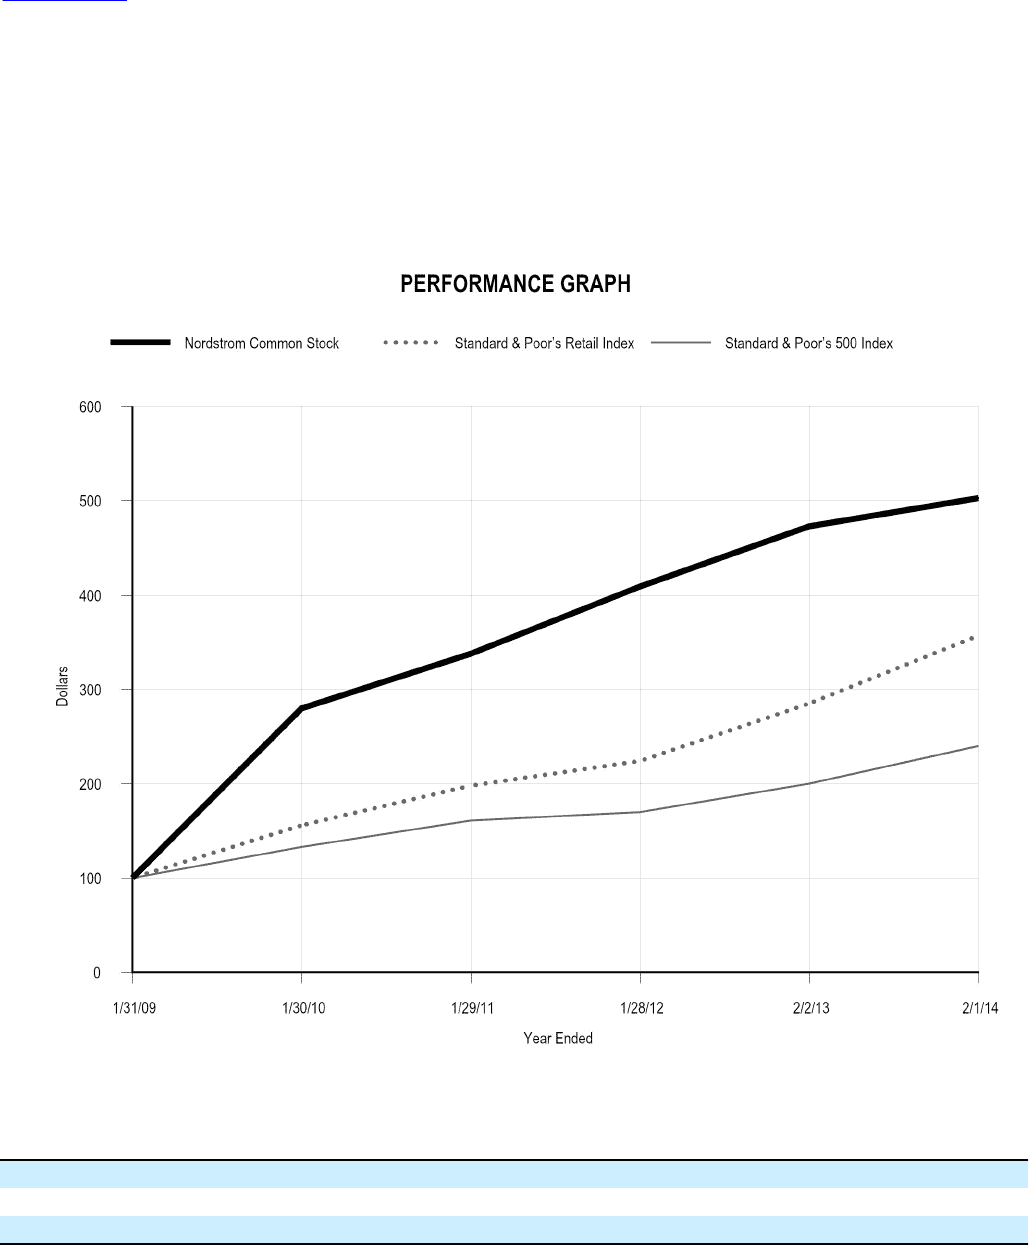
STOCK PRICE PERFORMANCE
The following graph compares the cumulative total return of Nordstrom common stock, Standard & Poor’s Retail Index (“S&P Retail”) and
Standard & Poor’s 500 Index (“S&P 500”) for each of the last five fiscal years, ending February 1, 2014. The Retail Index is composed of 31
retail companies, including Nordstrom, representing an industry group of the S&P 500 Index. The following graph assumes an initial
investment of $100 each in Nordstrom common stock, the S&P Retail and the S&P 500 on January 31, 2009 and assumes reinvestment of
dividends on the Nordstrom common stock as well as the S&P Retail and S&P 500 Indexes.
End of fiscal year 2008 2009 2010 2011 2012 2013
Nordstrom common stock 100 280 338 409 473 503
Standard & Poor’s Retail 100 156 198 224 285 357
Standard & Poor’s 500 100 133 161 170 200 240
Table of Contents