Nordstrom 2013 Annual Report Download - page 18
Download and view the complete annual report
Please find page 18 of the 2013 Nordstrom annual report below. You can navigate through the pages in the report by either clicking on the pages listed below, or by using the keyword search tool below to find specific information within the annual report.-
 1
1 -
2
-
3
-
4
-
5
-
6
-
7
-
 8
8 -
 9
9 -
 10
10 -
 11
11 -
 12
12 -
 13
13 -
 14
14 -
 15
15 -
 16
16 -
 17
17 -
 18
18 -
 19
19 -
 20
20 -
 21
21 -
 22
22 -
 23
23 -
 24
24 -
 25
25 -
 26
26 -
 27
27 -
 28
28 -
29
-
30
-
31
-
32
-
33
-
34
-
35
-
36
-
37
-
38
-
39
-
40
-
41
-
42
-
43
-
44
-
45
-
46
-
47
-
48
-
49
-
50
-
51
-
52
-
53
-
54
-
55
-
56
-
57
-
58
-
59
-
60
-
61
-
62
-
63
-
64
-
65
-
66
-
67
-
68
-
69
-
70
-
71
-
72
-
73
-
74
 |
 |

18
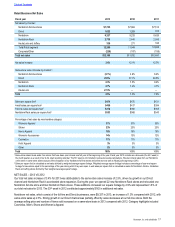
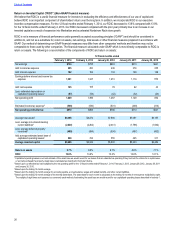
Full-line net sales for 2013 were $7,705, a decrease of 3.3% compared with 2012, while sales per square foot decreased 3.4%. Both were
primarily driven by a same-store sales decrease of 2.1%. The top-performing geographic regions for full-line stores for 2013 were the
Southwest and Southeast. The Direct channel continued to show strong sales growth with net sales of $1,622, an increase of 28% compared
with 2012, with same-store sales up 30% on a comparable 52-week basis. These increases were driven by expanded merchandise selection
and ongoing technology investments to enhance the customer experience.
Nordstrom Rack net sales were $2,738, an increase of 12.0% compared with 2012 primarily due to 37 new store openings in the last two
years. Same-store sales increased 2.7% for the year. Sales per square foot decreased 2.6% for the year as a result of the 53rd week in 2012,
as well as the growth in new stores that typically take several years to reach the overall average of our mature stores. Cosmetics and Shoes
were the strongest-performing categories for the year. Both the average selling price and the number of items sold on a same-store basis
increased in 2013 compared with 2012.
NET SALES – 2012 VS 2011
Net sales for 2012 increased 12.1% compared with 2011, driven by a same-store sales increase of 7.3% and strong performances across all
channels. During 2012, we opened one Nordstrom full-line store, 15 Nordstrom Rack stores and relocated three Nordstrom Rack stores.
These additions represented 1.5% of our total net sales for 2012, and increased our square footage by 2.2%. The 53rd week contributed
approximately $162 in additional net sales.
Nordstrom net sales for 2012 were $9,233, an increase of 9.6% compared with 2011, with same-store sales up 7.5%. Our sales growth was
due in large part to the ongoing, consistent strength of our business both in store and online. Both the number of items sold and the average
selling price increased on a same-store basis in 2012 compared with 2011. Category highlights included Handbags, Men’s Shoes, Men’s
Apparel and Cosmetics.
Full-line net sales for 2012 were $7,964, an increase of 6.0% compared with 2011, while sales per square foot increased 5.5%. Same-store
sales increased 3.9% for the year. The top-performing geographic regions for full-line stores for 2012 were the South and Midwest. The
Direct channel showed strong sales growth with net sales of $1,269, an increase of 39% compared with 2011, with same-store sales up 37%
on a comparable 52-week basis.
Nordstrom Rack net sales were $2,445, up 20% compared with 2011, while sales per square foot increased 4.2%. Same-store sales
increased 7.4% for the year. Men’s Apparel, Shoes and Women’s Apparel were the strongest-performing categories for the year. Both the
number of items sold and the average selling price increased on a same-store basis in 2012 compared with 2011.
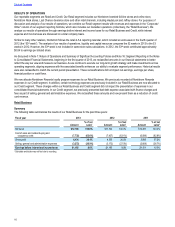
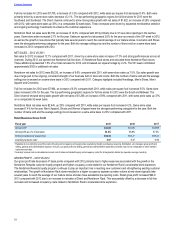
Retail Business Gross Profit
Fiscal year 2013 2012 2011
Gross profit1$4,434 $4,335 $3,909
Gross profit as a % of net sales 36.4% 36.9% 37.2%
Ending inventory per square foot $58.84 $53.77 $46.41
Inventory turnover rate25.07 5.37 5.56
1 Retailers do not uniformly record the costs of buying and occupancy and supply chain operations (freight, purchasing, receiving, distribution, etc.) between gross profit and
selling, general and administrative expense. As such, our gross profit and selling, general and administrative expenses and rates may not be comparable to other retailers’
expenses and rates.
2 Inventory turnover rate is calculated as annual cost of sales and related buying and occupancy costs (for all segments) divided by 4-quarter average inventory.
GROSS PROFIT – 2013 VS 2012
Our gross profit rate decreased 41 basis points compared with 2012 primarily due to higher expenses associated with the growth in the
Nordstrom Rewards customer loyalty program and higher occupancy costs related to our Nordstrom Rack’s accelerated store expansion.
The Nordstrom Rewards loyalty program continues to play an important role in reaching new customers and strengthening existing customer
relationships. The growth in Nordstrom Rack stores resulted in a higher occupancy expense as sales volume at new stores typically take
several years to reach the average of our mature stores and also have substantial pre-opening costs. Retail gross profit increased $99 in
2013 compared with 2012 due to an increase in net sales at Direct and Nordstrom Rack. This was partially offset by a decrease in full-line
net sales and increased occupancy costs related to Nordstrom Rack’s accelerated store expansion.
Table of Contents