Nordstrom 2013 Annual Report Download - page 46
Download and view the complete annual report
Please find page 46 of the 2013 Nordstrom annual report below. You can navigate through the pages in the report by either clicking on the pages listed below, or by using the keyword search tool below to find specific information within the annual report.-
 1
1 -
2
-
3
-
4
-
5
-
6
-
7
-
8
-
9
-
10
-
11
-
12
-
13
-
14
-
15
-
16
-
17
-
18
-
19
-
20
-
21
-
22
-
23
-
24
-
25
-
26
-
27
-
28
-
29
-
30
-
31
-
32
-
33
-
34
-
35
-
 36
36 -
 37
37 -
 38
38 -
 39
39 -
 40
40 -
 41
41 -
 42
42 -
 43
43 -
 44
44 -
 45
45 -
 46
46 -
 47
47 -
 48
48 -
 49
49 -
 50
50 -
 51
51 -
 52
52 -
 53
53 -
 54
54 -
 55
55 -
 56
56 -
57
-
58
-
59
-
60
-
61
-
62
-
63
-
64
-
65
-
66
-
67
-
68
-
69
-
70
-
71
-
72
-
73
-
74
 |
 |

46
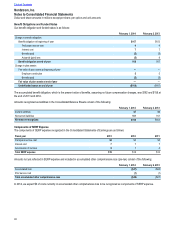
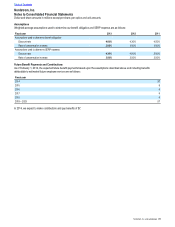
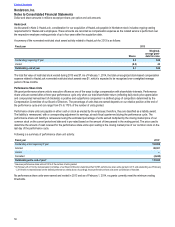
Under certain circumstances, we may make modifications to payment terms for a customer experiencing financial difficulties in an effort to
help the customer avoid a charge-off or bankruptcy, and to maximize our recovery of the outstanding balance. These modifications, which
meet the accounting definition of troubled debt restructurings (“TDRs”), include reduced or waived fees and finance charges, and/or reduced
minimum payments. Receivables classified as TDRs are as follows:
February 1, 2014 February 2, 2013
Credit card receivables classified as TDRs $43 $53
Percent of total credit card receivables classified as TDRs 2.0% 2.5%
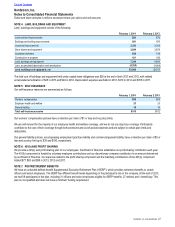
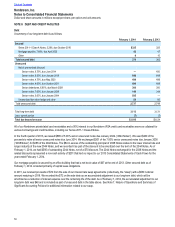
Credit Quality
The primary indicators of the credit quality of our credit card receivables are aging and delinquency, particularly the levels of account
balances delinquent 30 days or more as these are the accounts most likely to be written off. The following table illustrates the aging and
delinquency status of our credit card receivables:
February 1, 2014 February 2, 2013
Balance % of total Balance % of total
Current $2,046 93.7% $2,018 94.2%
1 – 29 days delinquent 99 4.5% 84 3.9%
30 days or more delinquent:
30 – 59 days delinquent 16 0.7% 15 0.7%
60 – 89 days delinquent 9 0.4% 10 0.5%
90 days or more delinquent 14 0.7% 15 0.7%
Total 30 days or more delinquent 39 1.8% 40 1.9%
Total credit card receivables $2,184 100.0% $2,142 100.0%
Receivables not accruing finance charges $13 $11
Receivables 90 days or more delinquent and still
accruing finance charges $8 $8
We also evaluate credit quality using FICO credit scores. The following table illustrates the distribution of our credit card receivables across
FICO score ranges:
February 1, 2014 February 2, 2013
FICO Score Range1Balance % of total Balance % of total
801+ $313 14.3% $310 14.5%
660 – 800 1,393 63.8% 1,366 63.8%
001 – 659 379 17.4% 379 17.7%
Other299 4.5% 87 4.0%
Total credit card receivables $2,184 100.0% $2,142 100.0%
1 Credit scores for our cardholders are updated at least every 60 days for active accounts and every 90 days for inactive accounts. Amounts listed in the table reflect the most
recently obtained credit scores as of the dates indicated.
2 Other consists of amounts not yet posted to customers’ accounts and receivables from customers for whom FICO scores are temporarily unavailable.
Table of Contents
Nordstrom, Inc.
Notes to Consolidated Financial Statements
Dollar and share amounts in millions except per share, per option and unit amounts