Nordstrom 2013 Annual Report Download - page 19
Download and view the complete annual report
Please find page 19 of the 2013 Nordstrom annual report below. You can navigate through the pages in the report by either clicking on the pages listed below, or by using the keyword search tool below to find specific information within the annual report.-
 1
1 -
2
-
3
-
4
-
5
-
6
-
7
-
8
-
 9
9 -
 10
10 -
 11
11 -
 12
12 -
 13
13 -
 14
14 -
 15
15 -
 16
16 -
 17
17 -
 18
18 -
 19
19 -
 20
20 -
 21
21 -
 22
22 -
 23
23 -
 24
24 -
 25
25 -
 26
26 -
 27
27 -
 28
28 -
 29
29 -
30
-
31
-
32
-
33
-
34
-
35
-
36
-
37
-
38
-
39
-
40
-
41
-
42
-
43
-
44
-
45
-
46
-
47
-
48
-
49
-
50
-
51
-
52
-
53
-
54
-
55
-
56
-
57
-
58
-
59
-
60
-
61
-
62
-
63
-
64
-
65
-
66
-
67
-
68
-
69
-
70
-
71
-
72
-
73
-
74
 |
 |

Nordstrom, Inc. and subsidiaries 19
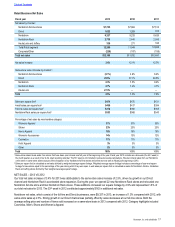
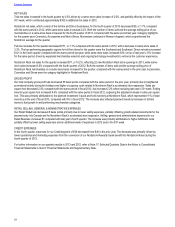
Our inventory turnover rate decreased to 5.07 times in 2013, from 5.37 times in 2012. This was primarily due to our increased investment in
pack and hold inventory at Nordstrom Rack, which helped fuel the growth in that channel. We began increasing our pack and hold inventory
investment in 2012, which involves the acquisition of merchandise from some of our top brands in advance of the upcoming selling seasons
in order to take advantage of strategic buying opportunities. We hold this inventory in our warehouses for six months on average until the
next selling season and it represented approximately 11%, 9% and 3% of our total inventory at the end of 2013, 2012 and 2011. On a per
square foot basis, we ended the year with a 9.4% increase in our ending inventory on a 0.8% increase in sales compared with 2012. The
increase in ending inventory per square foot relative to the increase in sales per square foot was primarily due to the impact of the 53rd week
in 2012, which decreased inventory levels in our full-line stores and included an additional week of sales in 2012. In 2013, we also planned
inventory increases in full-line stores to fuel growth in well-performing merchandise categories and increased our pack and hold inventory at
Nordstrom Rack.
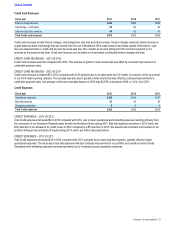
GROSS PROFIT – 2012 VS 2011
Our retail gross profit rate decreased 38 basis points compared with 2011 primarily due to accelerated Nordstrom Rack growth and higher
expenses associated with the growth in the Nordstrom Rewards program. Retail gross profit increased $426 in 2012 compared with 2011
primarily due to our strong sales performance, partially offset by increases in occupancy costs for our investments in new stores and
remodeling of existing stores.
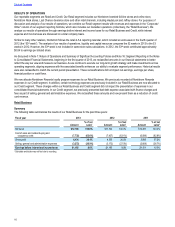
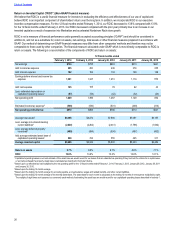
Retail Business Selling, General and Administrative Expenses
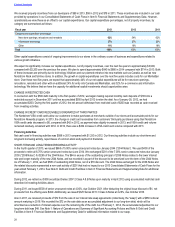
Fiscal year 2013 2012 2011
Selling, general and administrative expenses $3,272 $3,172 $2,808
Selling, general and administrative expenses as a % of net sales 26.9% 27.0% 26.7%
SELLING, GENERAL AND ADMINISTRATIVE EXPENSES – 2013 VS 2012
Our Retail selling, general and administrative expenses (“Retail SG&A”) rate decreased 8 basis points in 2013 compared with 2012 due to
expense leverage from increased sales volume. Our Retail SG&A increased $100 in 2013 compared with 2012 due primarily to growth-
related investments in our e-commerce business, Nordstrom Rack’s accelerated store expansion and our planned entry into Canada. The
increase also reflected expenses associated with higher sales volume and the opening of 22 new Nordstrom Rack stores in 2013.
SELLING, GENERAL AND ADMINISTRATIVE EXPENSES – 2012 VS 2011
Our Retail SG&A rate increased 23 basis points in 2012 compared with 2011 due to the investments we made to improve the customer
experience across all channels and specifically in our e-commerce business as we expanded our capabilities and increased the speed of
fulfillment and delivery. This was partially offset by leverage on increased sales. Our Retail SG&A expenses increased $364 in 2012
compared with 2011 due to the increased investments, higher sales volume and opening 16 stores in 2012.
Table of Contents